AI Model Performance Benchmark Comparison 2024
Benchmark Performance Comparison of AI Models

Overview
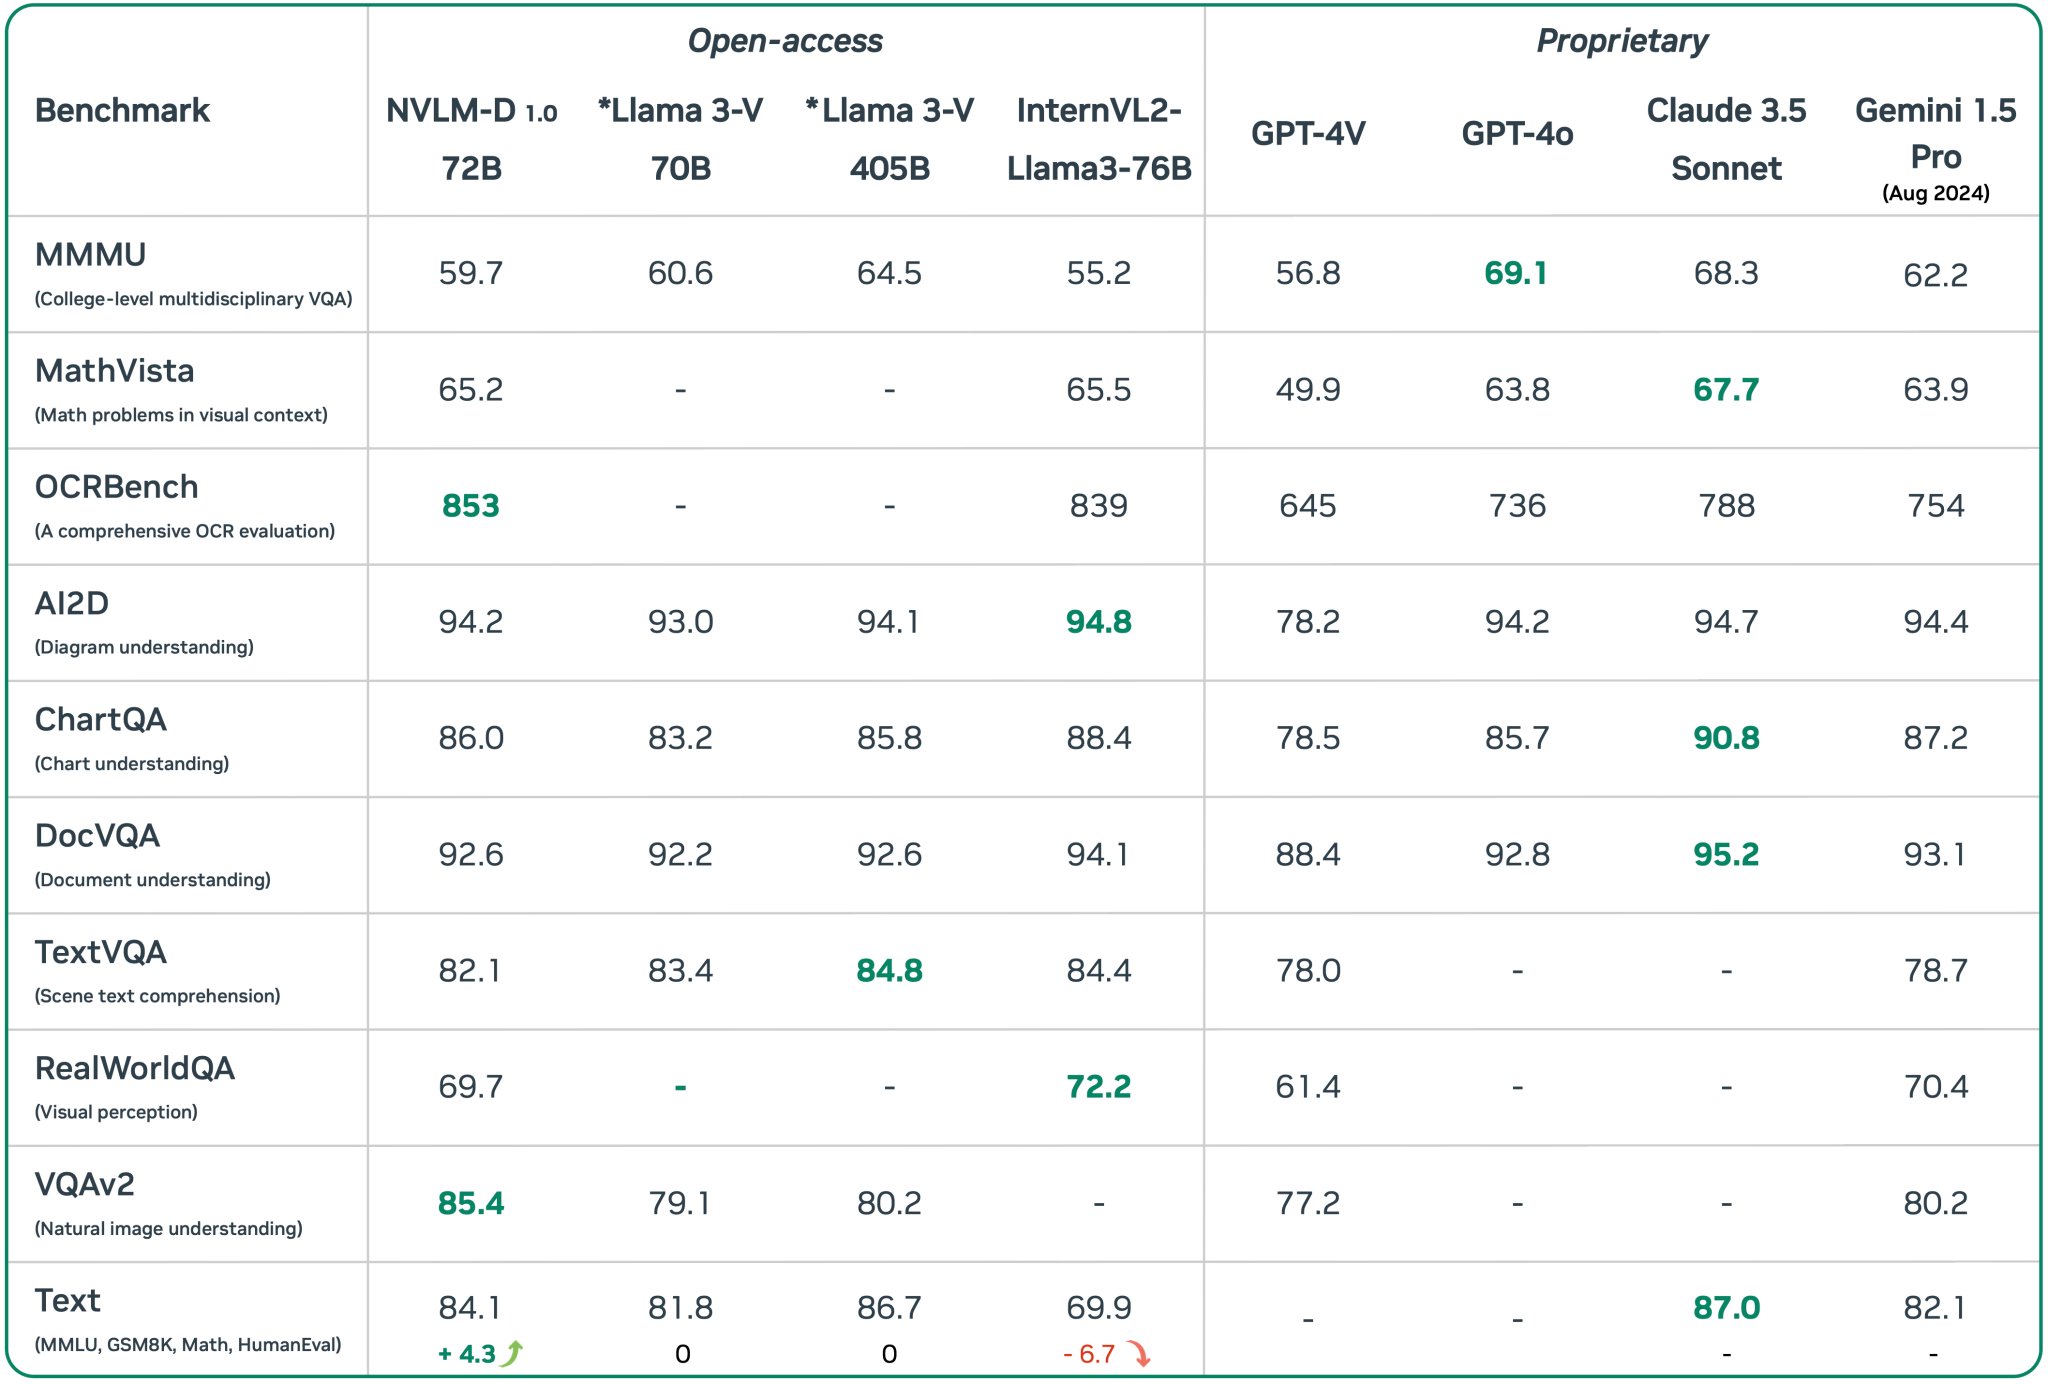
The image displays a table comparing the performance of different AI models across various benchmarks. Performance metrics are provided as scores, representing the efficacy of each model for specific tasks. The benchmarks span categories such as college-level multidisciplinary VQA, math problems in visual context, OCR evaluation, diagram understanding, chart understanding, document understanding, scene text comprehension, visual perception, natural image understanding, and various text comprehension tasks.
Notes and Thoughts:
-
Benchmark Categories: These benchmarks test specific capabilities of AI models, like VQA (Visual Question Answering), OCR (Optical Character Recognition), and general text comprehension. High scores indicate better performance and robustness of a model for that particular category.
-
Model Diversity: Both open-access and proprietary models are compared. Open-access models like NVLM-D, Llama 3-V, and InternVL2 are juxtaposed against proprietary models such as GPT-4V, Claude 3.5 Sonnet, and Gemini 1.5 Pro, providing a broad view of what various models can achieve.
-
Interpreting Scores: Higher scores denote better performance. Notably, NVLM-D 1.0 scores exceptionally high (853) on the OCRBench, showing its strength in OCR evaluations. In contrast, GPT-4V scores lower (645) in the same category, suggesting room for improvement in OCR tasks.
-
Strengths of Specific Models:
- NVLM-D 1.0 outperforms others in OCRBench overwhelmingly.
- InternVL2 is strong in AI2D (Diagram understanding) with a score of 94.8.
- Claude 3.5 Sonnet and Gemini 1.5 Pro show notable strength in ChartQA and DocVQA.
Detailed Table Information:
| Benchmark | NVLM-D 1.0 72B | Llama 3-V 70B | Llama 3-V 405B | InternVL2-Llama3-76B | GPT-4V | GPT-4o | Claude 3.5 Sonnet | Gemini 1.5 Pro (Aug 2024) |
|---|---|---|---|---|---|---|---|---|
| MMMU (Multidisciplinary VQA) | 59.7 | 60.6 | 64.5 | 55.2 | 56.8 | 69.1 | 68.3 | 62.2 |
| MathVista (Math in Visual Context) | 65.2 | - | - | 65.5 | 49.9 | 63.8 | 67.7 | 63.9 |
| OCRBench (OCR Evaluation) | 853 | - | - | 839 | 645 | 736 | 788 | 754 |
| AI2D (Diagram Understanding) | 94.2 | 93.0 | 94.1 | 94.8 | 78.2 | 94.2 | 94.7 | 94.4 |
| ChartQA (Chart Understanding) | 86.0 | 83.2 | 85.8 | 88.4 | 78.5 | 85.7 | 90.8 | 87.2 |
| DocVQA (Document Understanding) | 92.6 | 92.2 | 92.6 | 94.1 | 88.4 | 92.8 | 95.2 | 93.1 |
| TextVQA (Scene Text Comprehension) | 82.1 | 83.4 | 84.8 | 84.4 | 78.0 | - | - | 78.7 |
| RealWorldQA (Visual Perception) | 69.7 | - | - | 72.2 | 61.4 | - | - | 70.4 |
| VQAv2 (Natural Image Understanding) | 85.4 | 79.1 | 80.2 | - | 77.2 | - | - | 80.2 |
| Text Comprehension | 84.1 | 81.8 | 86.7 | 69.9 | - | - | 87.0 | 82.1 |
Additional Observations:
- Model Evolution: Llama 3-V is represented in different scales (70B and 405B), indicating iterations and improvements in the same model series.
- Impact of Proprietary Models: Proprietary models like Claude 3.5 Sonnet and Gemini 1.5 Pro seem competitive, with some higher scores in specific tasks compared to open-access models.
These comparative benchmarks provide a valuable insight into the current capabilities and specializations of leading AI models in 2024.
Reference: