SaaStr 2024 - Key Customer Success Topics for Investor Discussions
10 Customer Success Topics Investors Will Grill You About

Keynote Speaker
- Speaker: Nick Mehta
- Title: CEO
- Company: Gainsight
- Thoughts: As CEO of Gainsight, Nick Mehta has significant expertise in customer success, which he'll share in this talk. Gainsight is known for its customer success platform, and his insights are expected to be highly valuable.
Main Topic
- Title: 10 Customer Success Topics Investors Will Grill You About
- Thoughts: This title implies that the session will cover critical customer success areas that are of interest to investors. It suggests a focus on preparedness and key performance metrics that attract investor scrutiny.
Context and Relevance
SaaStr Annual Conference
- Conference: SaaStr Annual
- Thoughts: This is a major event in the SaaS (Software as a Service) industry, where founders, executives, and investors gather to share knowledge and network. The SaaStr Annual conference is renowned for its focus on best practices and growth strategies for SaaS companies.
Visual Elements
- Design: The visual design includes a sky with clouds and geometric shapes, creating an informal yet professional atmosphere.
- Thoughts: The use of clouds and geometric shapes indicates a theme of innovation and broad thinking, suggesting that the topics discussed will be forward-looking and strategic.
Additional Thoughts on Content
- Customer Success: This session seems particularly useful for SaaS startups and companies looking to secure funding or gain investor trust by excelling in customer success.
- Key Areas: Anticipate that the discussion might cover metrics like customer retention rates, customer lifetime value (CLV), net promoter score (NPS), and strategies for scaling customer success operations.
By providing this information, attendees can better prepare for investor meetings and align their customer success strategies with investor expectations.
Reference:
Key Insights on Company Metrics and Evaluations
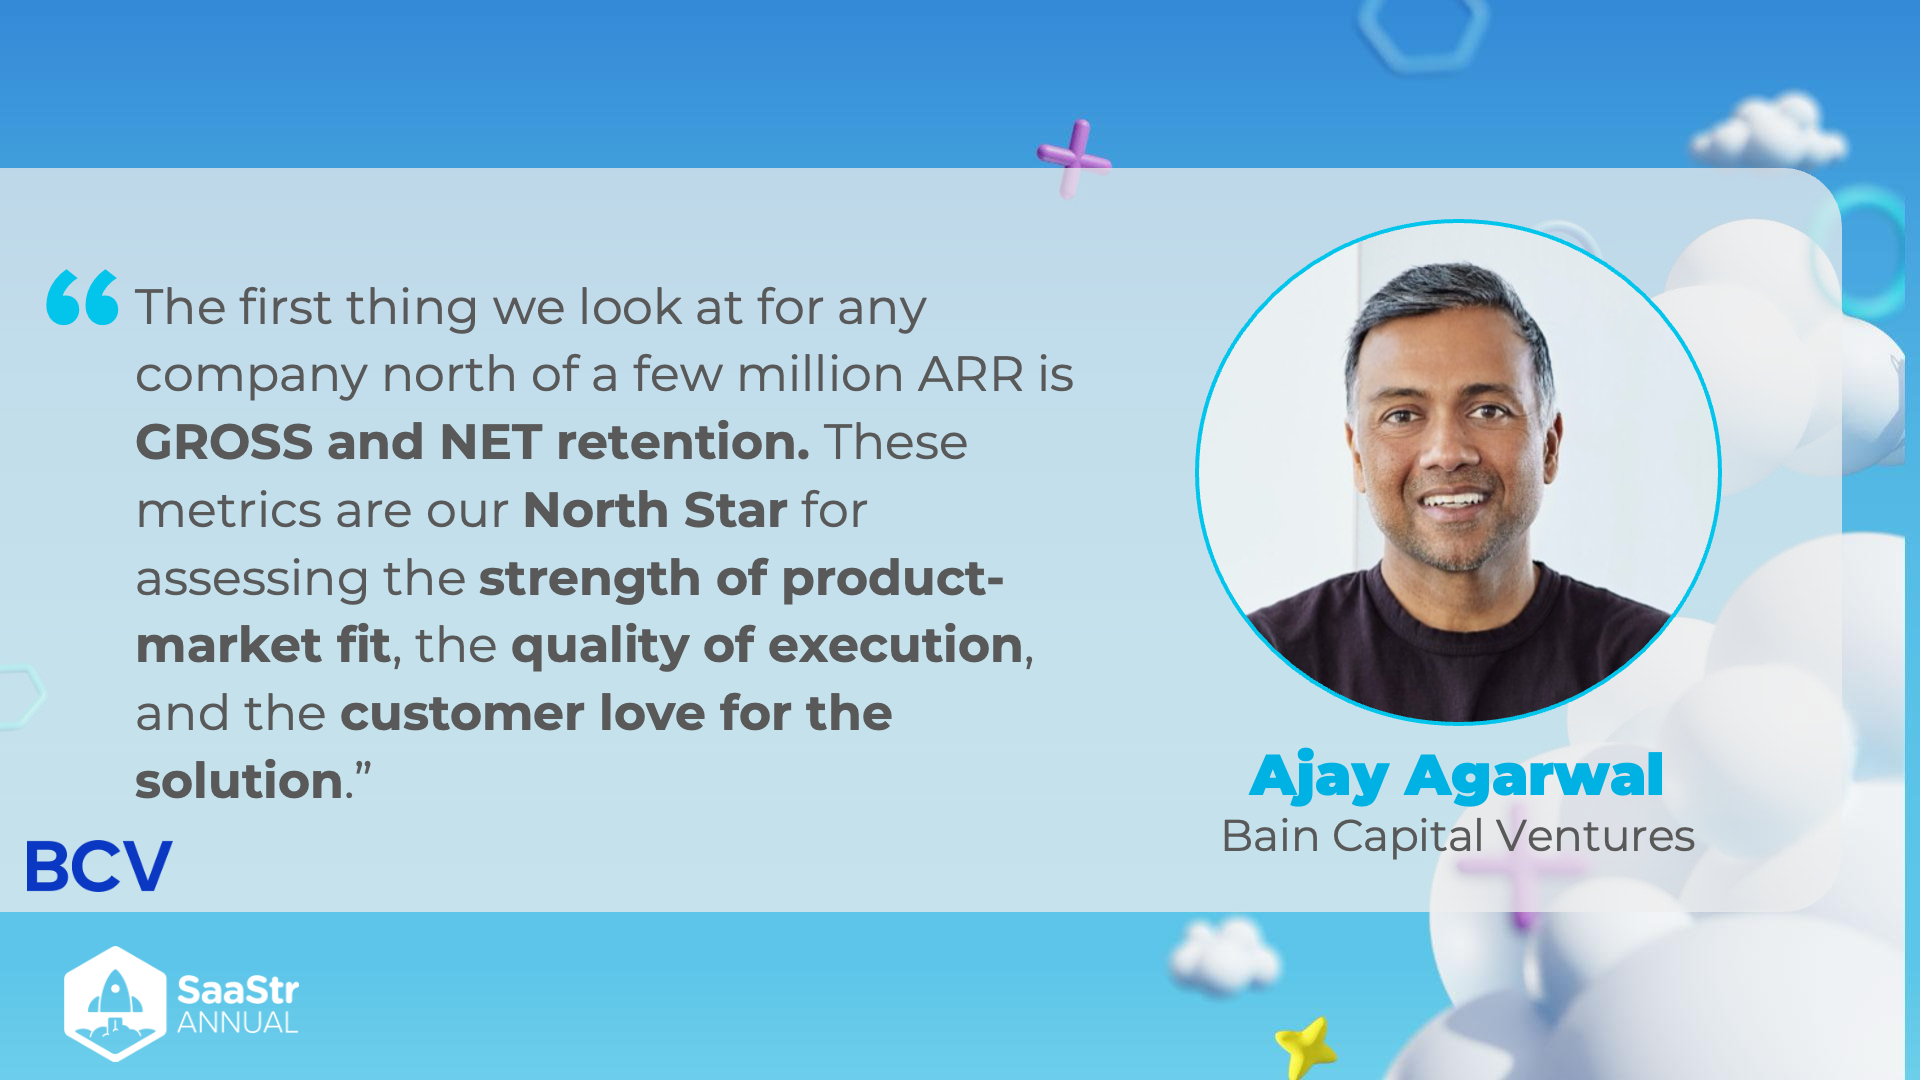
Importance of Retention Metrics
- Gross and Net Retention:
- Retention metrics are vital to any company exceeding a few million in Annual Recurring Revenue (ARR).
- Both Gross and Net Retention are crucial indicators used to assess business health.
Evaluation Criteria
- Retention as North Star Metric:
- Gross and Net retention metrics are considered the "North Star" for evaluation.
- These metrics guide the assessment of:
- Strength of Product-Market Fit:
- Indicates how well the product satisfies the demand in the market.
- Quality of Execution:
- Reflects the efficiency and effectiveness in delivering the product or service.
- Customer Love for the Solution:
- Measures the satisfaction and loyalty of the customers towards the company’s offerings.
- Strength of Product-Market Fit:
Visual Elements
- Image of Ajay Agarwal:
- The quotation is attributed to Ajay Agarwal from Bain Capital Ventures.
- His visual presence reinforces the reliability and professionalism of the statement.
Related Organizations
- BCV:
- Represented in the lower left corner, indicating Bain Capital Ventures.
- BCV is likely involved in the evaluation and investment in such companies.
- SaaStr Annual:
- The logo suggests the context is part of a discussion or presentation at the SaaS annual event, a major gathering for SaaS companies and professionals.
Additional Context
- Metric Deep Dive:
- Understanding Gross Retention involves looking at the total amount retained without considering any upsells.
- Net Retention accounts for both the retained revenue and any expansion revenue, showing a fuller picture of customer growth and retention.
Summary
This image emphasizes the critical role of gross and net retention metrics in evaluating the performance and growth potential of companies with significant ARR. These metrics are essential in measuring product-market fit, execution quality, and customer satisfaction, guiding investors and stakeholders in making informed decisions.
Reference:
SaaS Investment Quote by Jeff Lieberman

Key Quote
- Quote: "If I was allowed only one metric to make a SaaS investment, it would be GRR...and by quite some margin."
- Thoughts/Ideas: The speaker emphasizes the importance of Gross Revenue Retention (GRR) as the key metric for evaluating SaaS investments. This suggests that GRR is a critical indicator of a company's ability to retain revenue from existing customers, which might be more important than other metrics like customer acquisition costs or net revenue retention.
Person Quoted
- Name: Jeff Lieberman
- Affiliation: Insight Venture Partners
- Thoughts/Ideas: Information about his affiliation with Insight Venture Partners highlights his expertise and credibility in investment, especially in the SaaS sector. It may suggest that Insight Venture Partners prioritizes GRR in their investment strategies.
Event
- Occasion: SaaStr Annual
- Thoughts/Ideas: SaaStr Annual is a major SaaS (Software as a Service) conference, which further emphasizes the significance of the viewpoints shared. This setting suggests the advice is geared towards SaaS founders and investors who attend such industry-specific events.
Visual Elements
- Design:
- Theme: Cloud-themed graphic design with elements of hexagonal shapes and cloud imagery.
- Color Scheme: Combination of blue and white, giving a professional and modern look.
- Logo: SaaStr Annual logo and Insight Venture Partners logo are present.
- Thoughts/Ideas: The imagery and logos reinforce the brand identity and the context of the conference, adding visual appeal and contextual relevance.
Additional Notes
- GRR (Gross Revenue Retention) : This metric measures the percentage of revenue retained from existing customers over a specific period, excluding any additional sales or expansion revenue.
- Importance: High GRR indicates low churn rates and stable revenue from the core customer base, which is a positive sign for investors.
Reference:
Gainsight 2024 CS Benchmark Report
Overview
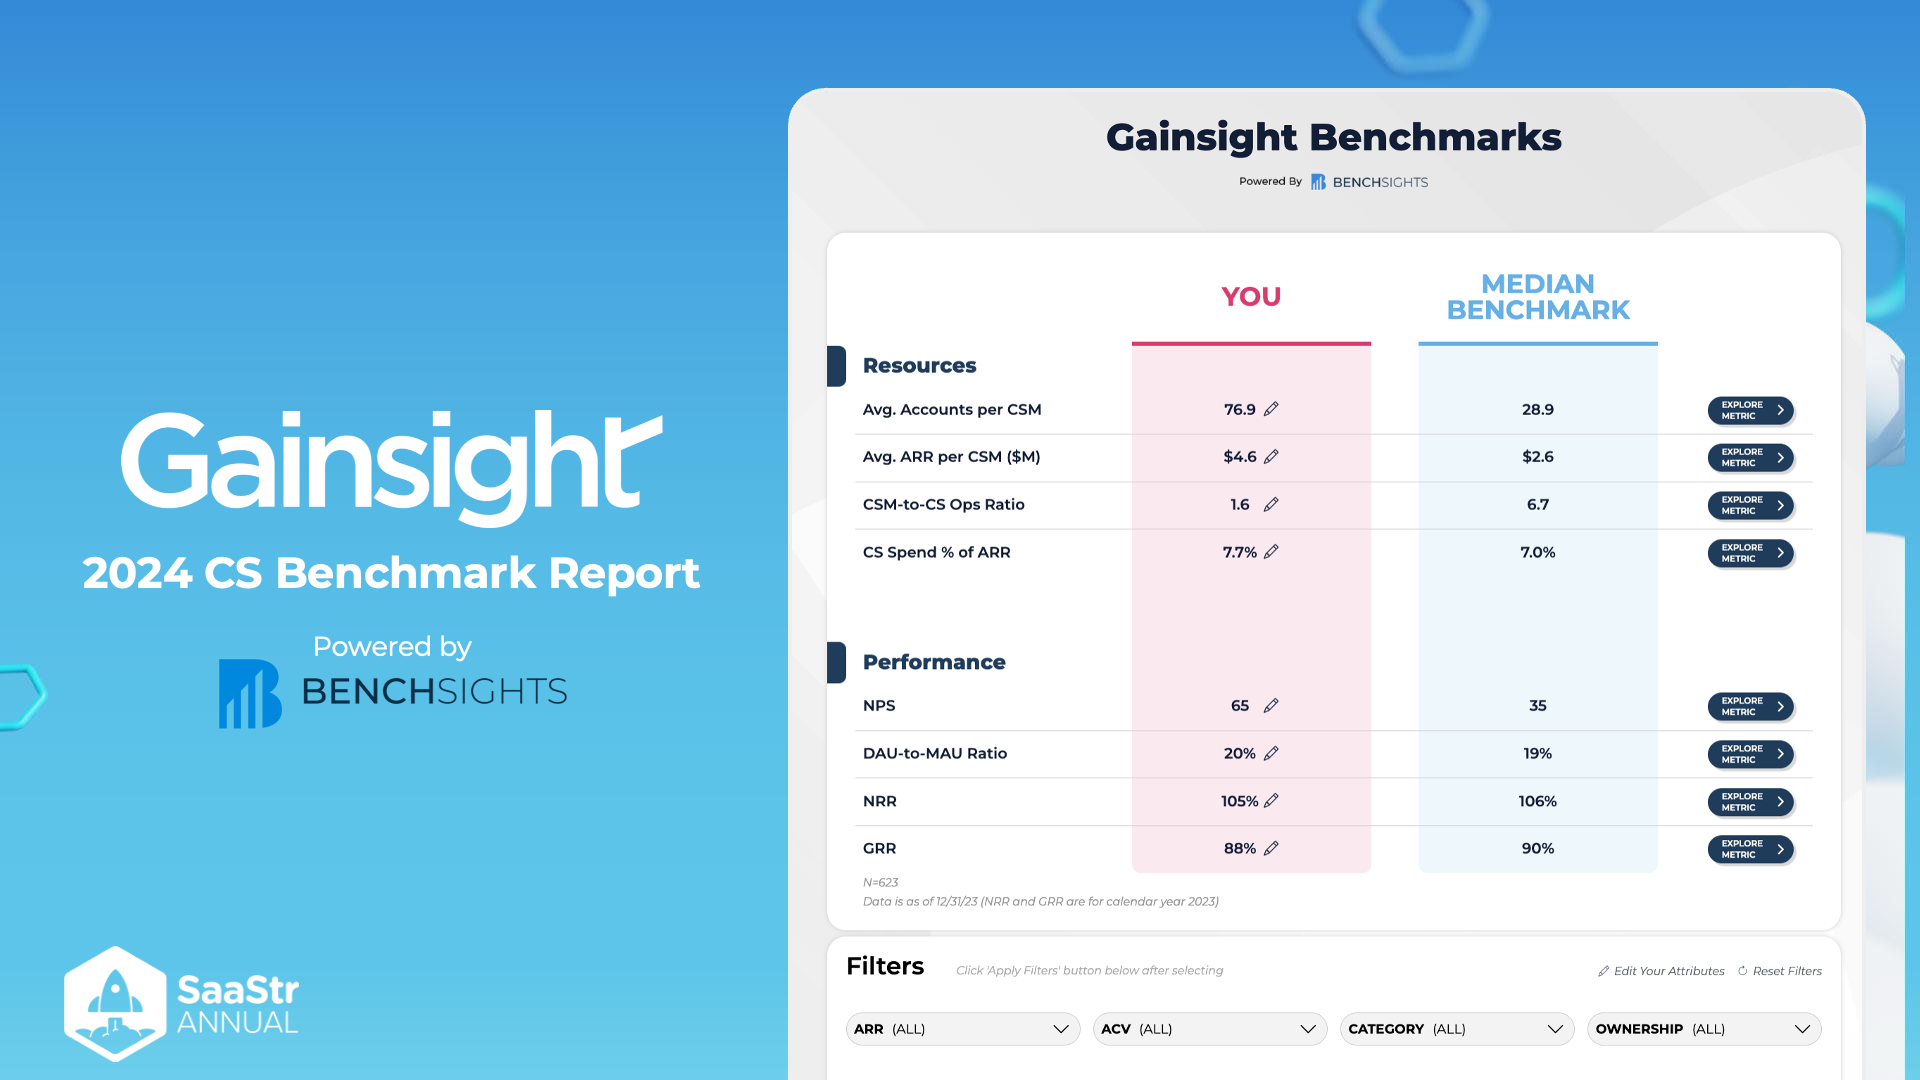
The image presents a summary of the Gainsight 2024 Customer Success (CS) Benchmark Report. The report is powered by BenchSights and provides key metrics comparing the user's data against the median benchmark.
Key Metrics
Resources
| Metric | You | Median Benchmark |
|---|---|---|
| Avg. Accounts per CSM | 76.9 | 28.9 |
| Avg. ARR per CSM ($M) | $4.6 | $2.6 |
| CSM-to-CS Ops Ratio | 1.6 | 6.7 |
| CS Spend % of ARR | 7.7% | 7.0% |
Thoughts/Ideas:
- Avg. Accounts per CSM: Your account managers handle significantly more accounts (76.9) compared to the median (28.9). This might indicate higher efficiency or a need for more resources depending on performance and client satisfaction.
- Avg. ARR per CSM ($M): The Annual Recurring Revenue (ARR) per Customer Success Manager (CSM) is considerably higher than the median benchmark.
- CSM-to-CS Ops Ratio: The ratio is much lower than the median, suggesting that there might be an imbalance in support or operational leverage.
- CS Spend % of ARR: Slightly above the median, indicating slightly higher investments in customer success compared to peers.
Performance
| Metric | You | Median Benchmark |
|---|---|---|
| NPS | 65 | 35 |
| DAU-to-MAU Ratio | 20% | 19% |
| NRR | 105% | 106% |
| GRR | 88% | 90% |
Thoughts/Ideas:
- NPS (Net Promoter Score): Your NPS is significantly higher than the median, reflecting better customer satisfaction and loyalty.
- DAU-to-MAU Ratio: Daily Active Users to Monthly Active Users ratio is slightly higher than the median, showing consistent user engagement.
- NRR (Net Revenue Retention): Just below the median, indicating good retention but with slight opportunity for improvement.
- GRR (Gross Revenue Retention): Slightly lower than the median, suggesting potential challenges in retaining revenue without upsells.
Additional Information
- Filters Section: Allows for customization and filtering by ARR, ACV, Category, and Ownership.
- Data Validity: The data is derived from a sample size (N) of 623, with a cutoff date mentioned as 12/31/23. NRR and GRR metrics are for the calendar year 2023.
Thoughts/Ideas:
- Filters: Using the filters effectively can help in tailoring the benchmark comparisons to more relevant peer sets or market segments.
- Data Validity: Ensure ongoing updates to keep comparisons relevant as market conditions and company performance evolve.
Reference:
Top 10 CS Questions Investors WILL Grill You About

-
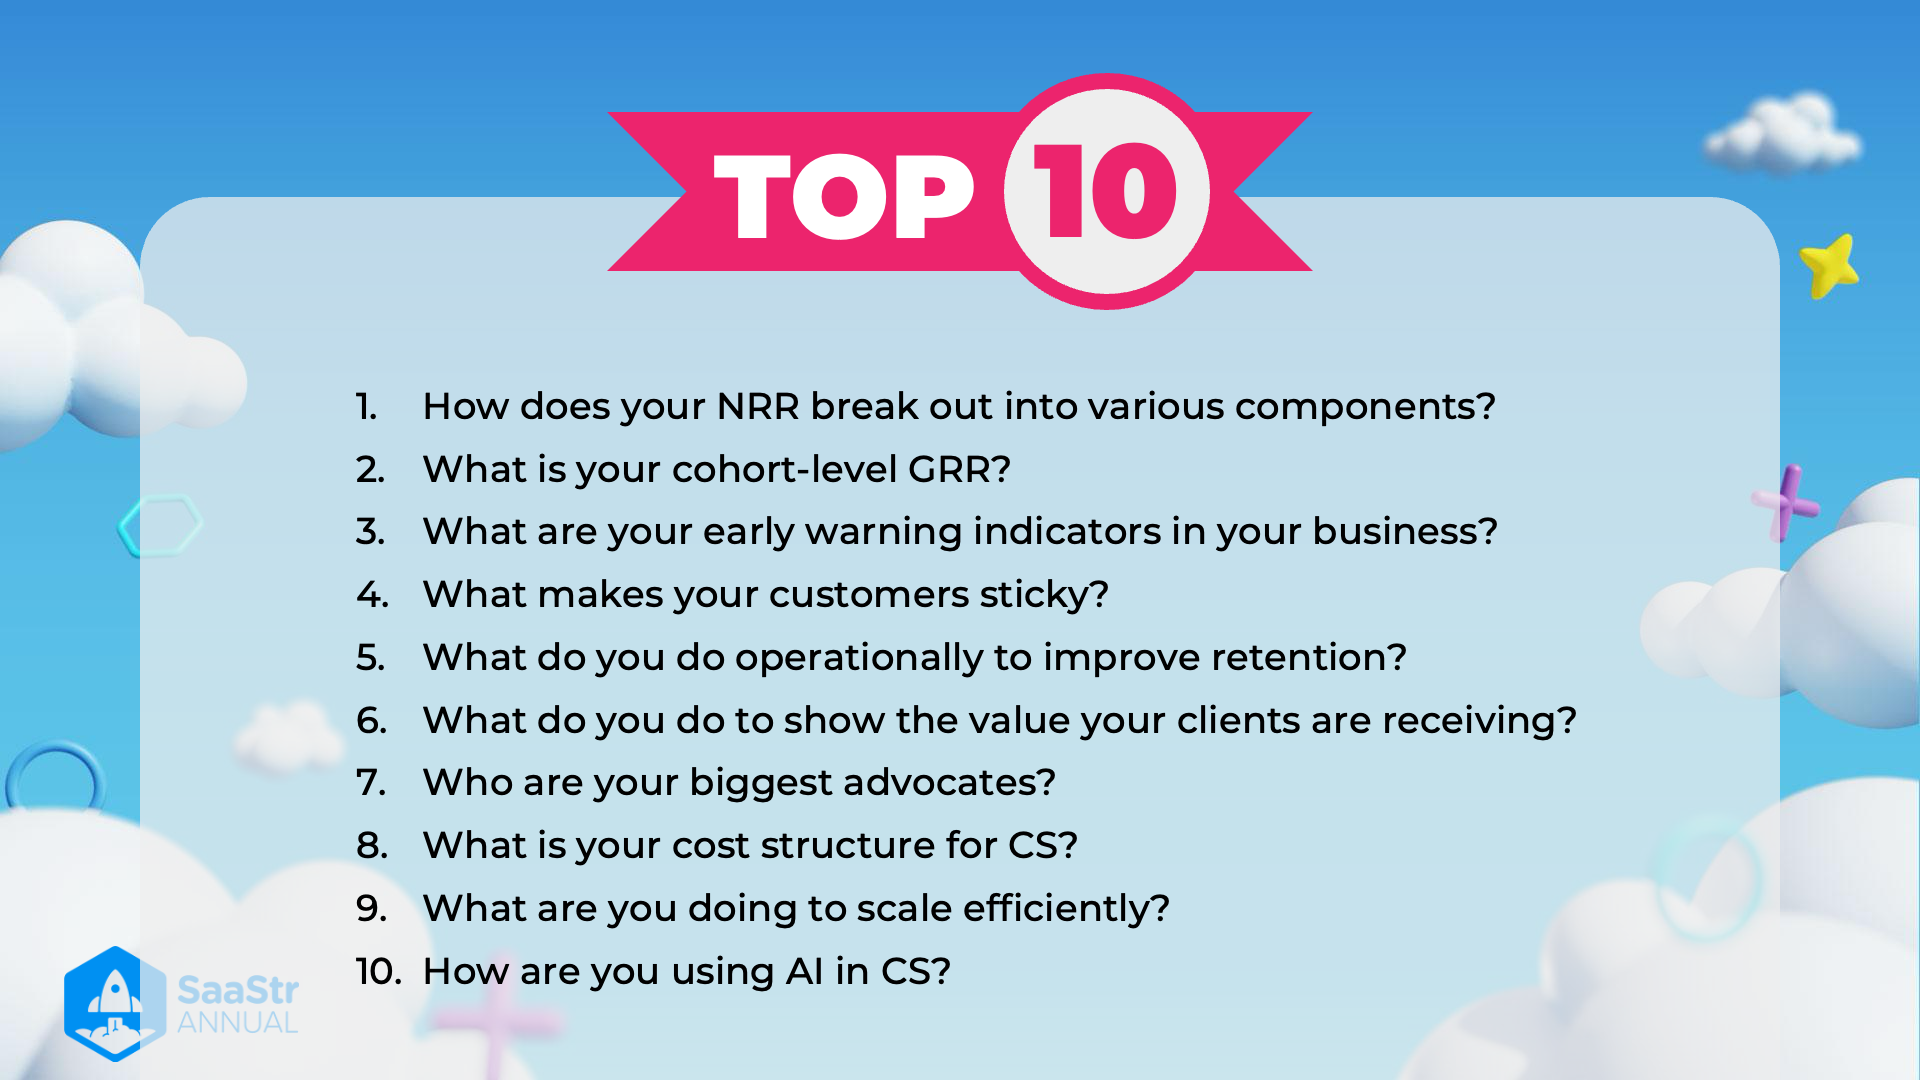
Title Area: "Top 10"
- Thoughts: The title area uses a vibrant, eye-catching design with the number "10" prominently featured in a red banner, indicating a top ten list.
- Additional Information: This type of design is often used to quickly grab attention. It's likely the topic is very relevant or frequently asked about in the related field.
-
Focus Topic: "CS Questions Investors WILL Grill You About”
- Thoughts: The main topic is centered around questions that customer success (CS) teams might face from investors.
- Additional Information: It implies that these are critical or challenging questions that investors consider important in decision-making processes.
-
Background Design
- Thoughts: The use of clouds, geometric shapes, and stars creates a playful and engaging atmosphere.
- Additional Information: Such designs are often used in presentations and infographics to keep the viewer engaged and interested.
-
SaaStr Annual Logo
- Thoughts: The logo in the bottom left suggests that this content is related to SaaStr Annual, a well-known event or brand in the SaaS (Software as a Service) industry.
- Additional Information: SaaStr Annual is a large event bringing together SaaS founders, VCs, and executives. The logo adds credibility and context to the image.
-
Contrast and Emphasis
- Thoughts: The use of bright colors with a blue sky background makes the text stand out clearly.
- Additional Information: Effective use of color contrast ensures that key messages are easily readable and memorable.
Implications for Customer Success Teams:
- Preparation for Investor Meetings: CS teams should be well-prepared to answer tough questions about customer success.
- Thoughts: Practice and know your key metrics and customer data.
- Critical Information: Focus on crucial customer success metrics.
- Thoughts: Investors might ask about customer acquisition cost (CAC), customer lifetime value (CLV), churn rate, and net promoter score (NPS).
- Metrics and Performance: Have clear, data-supported answers.
- Thoughts: Demonstrating strong customer success metrics can instill confidence in investors regarding the scalability and sustainability of the business.
Visual Aesthetics for Presentations:
- Engaging Design: Use playful and engaging graphics.
- Thoughts: Keeps the audience interested and helps in better retention of information.
- Professional Branding: Include relevant logos and branding elements.
- Thoughts: Adds credibility and context to your presentation.
By interpreting these elements, it's clear this image is designed to inform SaaS-based customer success teams about the kind of investor scrutiny they might face and how to be prepared for it using data and strong performance metrics.
Reference:
Top 10 Questions for Customer Success and Retention
-
How does your NRR break out into various components?
- Explanation: This question seeks to understand the breakdown of Net Revenue Retention (NRR), which includes expansion, contraction, and churn within customer segments.
- Additional Information: Net Revenue Retention is a crucial metric as it reflects the company's ability to retain and grow revenue from existing customers.
-
What is your cohort-level GRR?
- Explanation: Gross Revenue Retention measures the revenue retained from a cohort of customers over a period without considering upsells or expansion revenue.
- Additional Information: GRR is a vital metric for understanding the base retention rate, providing insights into customer satisfaction and product value.
-
What are your early warning indicators in your business?
- Explanation: Identifying early warning indicators can help predict potential churn or issues within segments of your customer base.
- Additional Information: Tracking these indicators allows businesses to proactively address issues before they result in lost customers.
-
What makes your customers sticky?
- Explanation: This question explores the factors and features that contribute to customer loyalty and repeat use of products or services.
- Additional Information: Understanding 'stickiness' helps businesses to enhance customer engagement and retention strategies.
-
What do you do operationally to improve retention?
- Explanation: Discusses operational strategies and processes implemented to increase customer retention rates.
- Additional Information: Examples include personalized customer support, proactive communication, and loyalty programs.
-
What do you do to show the value your clients are receiving?
- Explanation: Highlights the methods used to demonstrate to customers the value they gain from your products or services.
- Additional Information: This could involve regular reporting, case studies, ROI calculators, and customer testimonials.
-
Who are your biggest advocates?
- Explanation: Identifying your most enthusiastic and loyal customers who promote your brand and products.
- Additional Information: Leveraging customer advocates can help in building trust and attracting new customers.
-
What is your cost structure for CS?
- Explanation: Understanding the costs involved in Customer Success (CS) operations including tools, staff, and customer engagement activities.
- Additional Information: Effective CS cost management can enhance profitability and customer satisfaction.
-
What are you doing to scale efficiently?
- Explanation: Discusses strategies and practices implemented to scale Customer Success operations sustainably and efficiently.
- Additional Information: Scaling efficiently might involve automation, advanced analytics, and streamlined processes.
-
How are you using AI in CS?
- Explanation: Explores the implementation of artificial intelligence in Customer Success operations for improving efficiency and effectiveness.
- Additional Information: AI applications can include chatbots for customer service, predictive analytics for churn prediction, and personalized customer communication.
Net Revenue Retention vs. ARR
Overview:
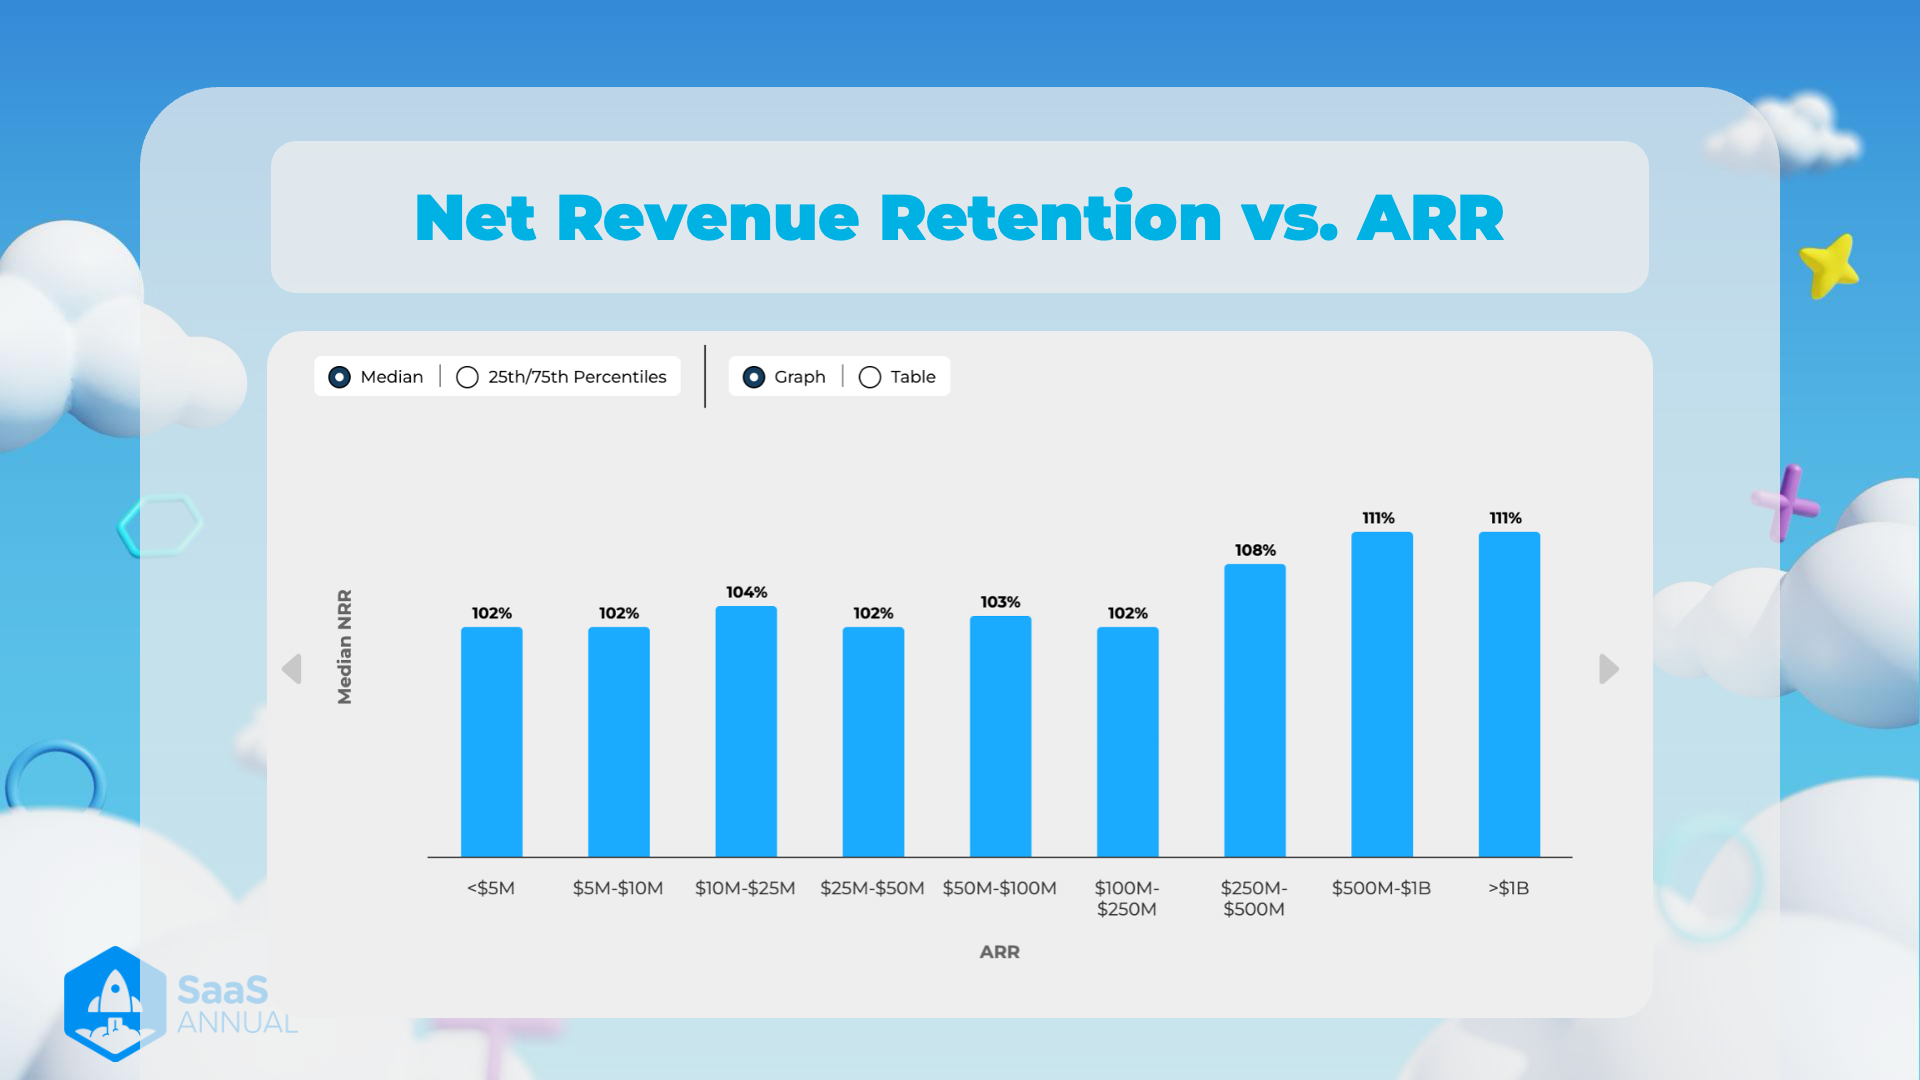
The image presents a bar chart visualizing the relationship between Net Revenue Retention (NRR) and Annual Recurring Revenue (ARR). Key details are as follows:
- Metric focus: Median NRR
- ARR Categories: Ranges from less than 1 billion
- Presentation: Graph format with the ability to switch to table format
Notes with Explanations:
ARR Categories and Corresponding Median NRR:
- <$5M: 102%
- Companies with less than $5 million ARR have a median NRR of 102%, indicating that they are slightly growing their revenue from existing customers over time.
- 10M: 102%
- Similar to the <5M and $10M also experience a 102% median NRR.
- 25M: 104%
- As companies scale to an ARR between 25M, their median NRR improves to 104%, demonstrating a better retention and upsell rate compared to smaller companies.
- 50M: 102%
- The median NRR drops back to 102% for companies in the 50M ARR range.
- 100M: 103%
- Companies with ARR between 100M experience a slight improvement, with a median NRR of 103%.
- 250M: 102%
- For the 250M ARR category, the median NRR returns to 102%.
- 500M: 108%
- There is a significant increase in NRR for companies with ARR between 500M, with a median NRR of 108%.
- 1B: 111%
- Companies within the 1B ARR range enjoy a healthy median NRR of 111%.
- >$1B: 111%
- Similar to the previous category, companies with ARR greater than $1 billion also have a median NRR of 111%, suggesting robust retention and upsell performance at the highest revenue scales.
Analysis of Trends:
- Growth Consistency: The median NRR remains relatively consistent across different ARR categories, showing slight fluctuations.
- Significant Increases: Notable increases in NRR are observed in the 500M and 1B categories.
- High Performance for Large Firms: Companies with ARR over $250M generally show better retention and upsell rates, indicating that scale may help improve these metrics.
Additional Observations:
- Possible Factors for Higher NRR: Larger companies might have more resources for customer success initiatives, resulting in higher NRR. They may also benefit from brand loyalty and stronger market positions.
- Implications for Smaller Firms: The relatively lower NRR for smaller companies suggests they might need to focus more on retention strategies and upselling existing customers to match the performance of larger peers.
Table Format (Extracted Data):
| ARR Category | Median NRR |
|---|---|
| <$5M | 102% |
| 10M | 102% |
| 25M | 104% |
| 50M | 102% |
| 100M | 103% |
| 250M | 102% |
| 500M | 108% |
| 1B | 111% |
| >$1B | 111% |
102% Average Net Retention (Compared to 105% Last Year)
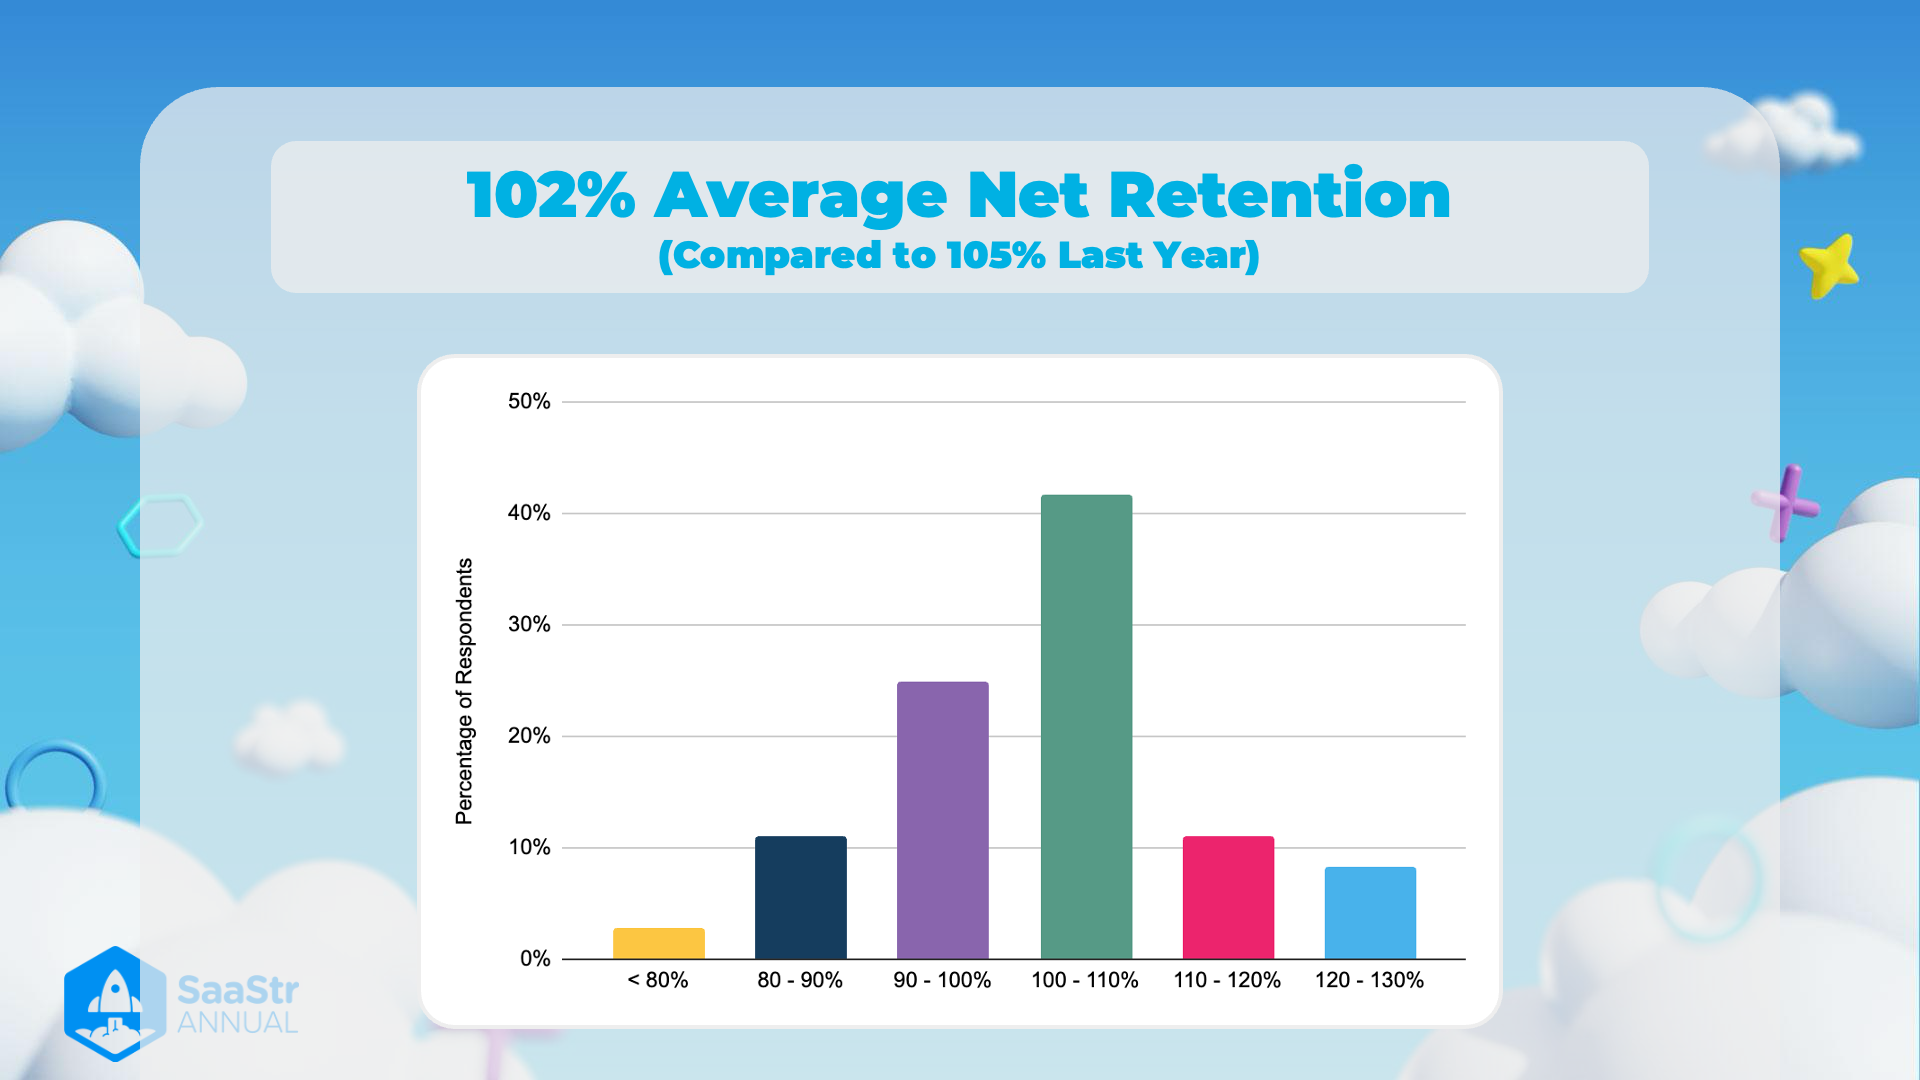
The image illustrates data regarding the average net retention for a certain year, highlighting a decline compared to the previous year.
Key Insights
1. Average Net Retention Rate:
- The average net retention rate for the current year is 102%.
- Last year's average was slightly higher at 105%.
- Thought: While a retention rate above 100% is generally positive, a decreasing trend could indicate emerging challenges in customer retention.
2. Distribution of Respondents:
- < 80%:
- Percentage of Respondents: ~2%
- Idea: Companies in this category likely face significant issues with customer churn.
- 80 - 90%:
- Percentage of Respondents: ~7%
- Idea: Slightly better retention but still a notable concern.
- 90 - 100%:
- Percentage of Respondents: ~18%
- Idea: These companies are able to retain most of their customers, with room for improvement.
- 100 - 110%:
- Percentage of Respondents: ~47%
- Idea: The largest group of respondents, indicating strong performance in retaining and expanding customer accounts.
- 110 - 120%:
- Percentage of Respondents: ~14%
- Idea: Excellent retention and expansion capabilities.
- 120 - 130%:
- Percentage of Respondents: ~12%
- Idea: Outstanding performance, indicating customers are not just staying but are purchasing more or upgrading services.
3. Visual Representation:
- The graph uses a bar chart to depict the percentage distribution of respondents across different net retention rate ranges.
- Thought: Visual aids like this can help quickly identify trends and areas of success or concern.
4. Branding:
- The bottom-left corner of the image contains the "SaaStr Annual" logo, indicating the source or context of the data.
- Idea: This suggests the image was produced in the context of an annual report or conference for SaaS (Software as a Service) businesses.
Table Format Data:
| Retention Rate Range | Percentage of Respondents |
|---|---|
| < 80% | ~2% |
| 80 - 90% | ~7% |
| 90 - 100% | ~18% |
| 100 - 110% | ~47% |
| 110 - 120% | ~14% |
| 120 - 130% | ~12% |
Understanding these data points can provide insights into how SaaS companies are performing in terms of retaining their customer base year over year.
Reference:
SaaStr Annual - Net Revenue Retention (NRR) Breakdown
Overview
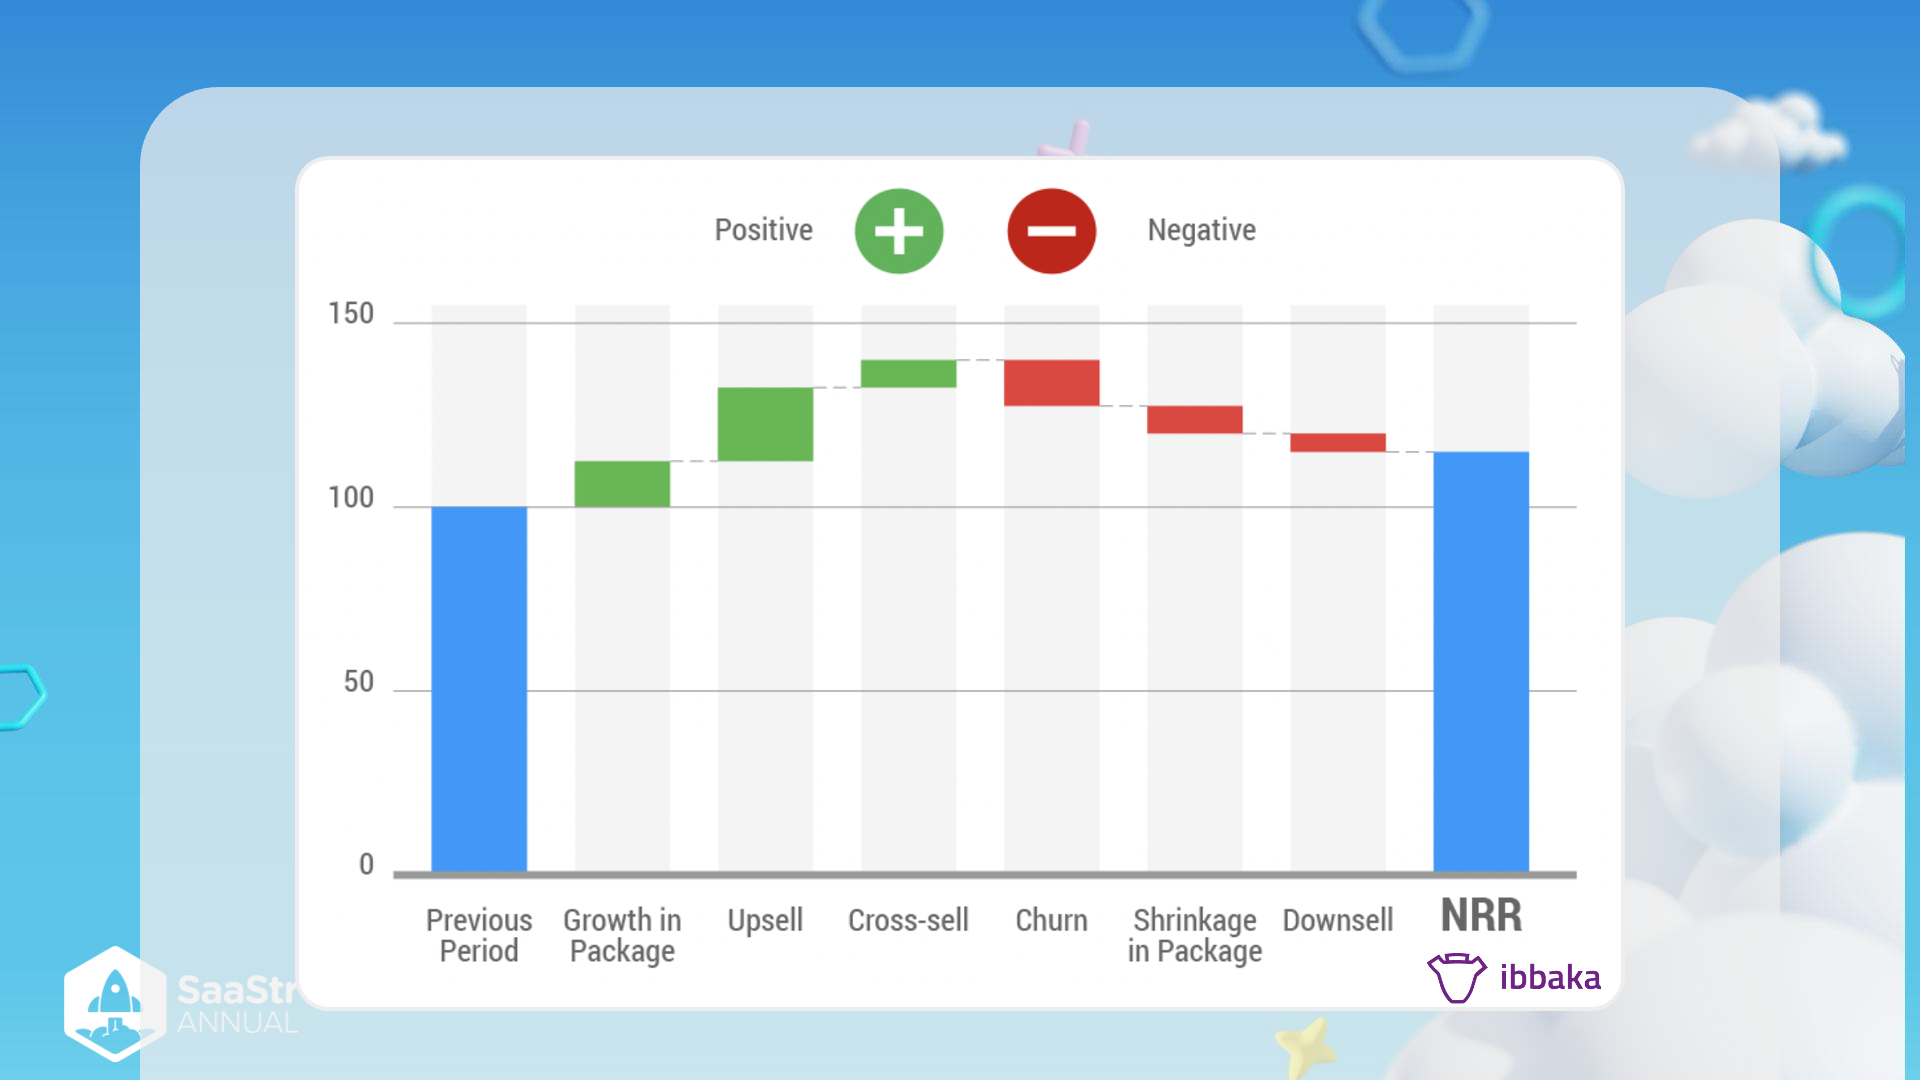
The image depicts a visual representation of different elements impacting Net Revenue Retention (NRR) for a SaaS product or service. NRR is a key metric that indicates the percentage of recurring revenue retained from existing customers.
Key Sections
1. Previous Period
- Color: Blue
- Detail: Represents the starting point at 100, which indicates the revenue from the previous period before any changes like upgrades, downgrades, or churn.
- Note: This period serves as the base for calculating growth or decline in revenue.
2. Growth in Package
- Color: Green
- Detail: Represents additional revenue generated from existing customers who increase their usage or move to a more expensive package.
- Note: Growth in package is a positive indicator, contributing to higher NRR.
3. Upsell
- Color: Green
- Detail: Additional revenue from selling higher-value features or advanced versions of the product to existing customers.
- Note: Similar to growth in package, upselling contributes positively to NRR by increasing the revenue from current customers.
4. Cross-sell
- Color: Green
- Detail: Revenue from selling complementary or additional products to existing customers.
- Note: Cross-selling helps in diversifying product usage, leading to an overall positive impact on NRR.
5. Churn
- Color: Red
- Detail: Represents revenue lost due to customers leaving or cancelling their subscription.
- Note: Churn is a negative component, reducing the overall NRR. It highlights the importance of customer retention strategies.
6. Shrinkage in Package
- Color: Red
- Detail: Revenue lost due to customers downgrading to a less expensive package or reducing their usage.
- Note: Shrinkage indicates a negative trend but often provides insight into customer satisfaction and value perception.
7. Downsell
- Color: Red
- Detail: Loss in revenue when customers switch to cheaper subscription plans.
- Note: Indicates negative customer sentiment or budget cuts, affecting NRR adversely.
Net Revenue Retention (NRR)
- Color: Blue
- Detail: The final metric, showing the overall percentage of retained revenue after considering all positive and negative changes.
- Note: A critical measure of business health, indicating the effectiveness of growth strategies and customer satisfaction levels.
Final Thoughts
Understanding the factors influencing NRR is essential for SaaS businesses to strategize customer retention and revenue growth effectively. Monitoring these segments helps in pinpointing areas for improvement and opportunities for upsell and cross-sell initiatives.
Table of Elements:
| Segment | Type | Color | Impact |
|---|---|---|---|
| Previous Period | Baseline | Blue | Neutral |
| Growth in Package | Positive | Green | Increases |
| Upsell | Positive | Green | Increases |
| Cross-sell | Positive | Green | Increases |
| Churn | Negative | Red | Decreases |
| Shrinkage in Package | Negative | Red | Decreases |
| Downsell | Negative | Red | Decreases |
| NRR | Net Total | Blue | Varies |
By focusing on these key components, businesses can develop targeted strategies to enhance their Net Revenue Retention and achieve sustainable growth.
Gross Revenue Retention vs. ARR
Overview
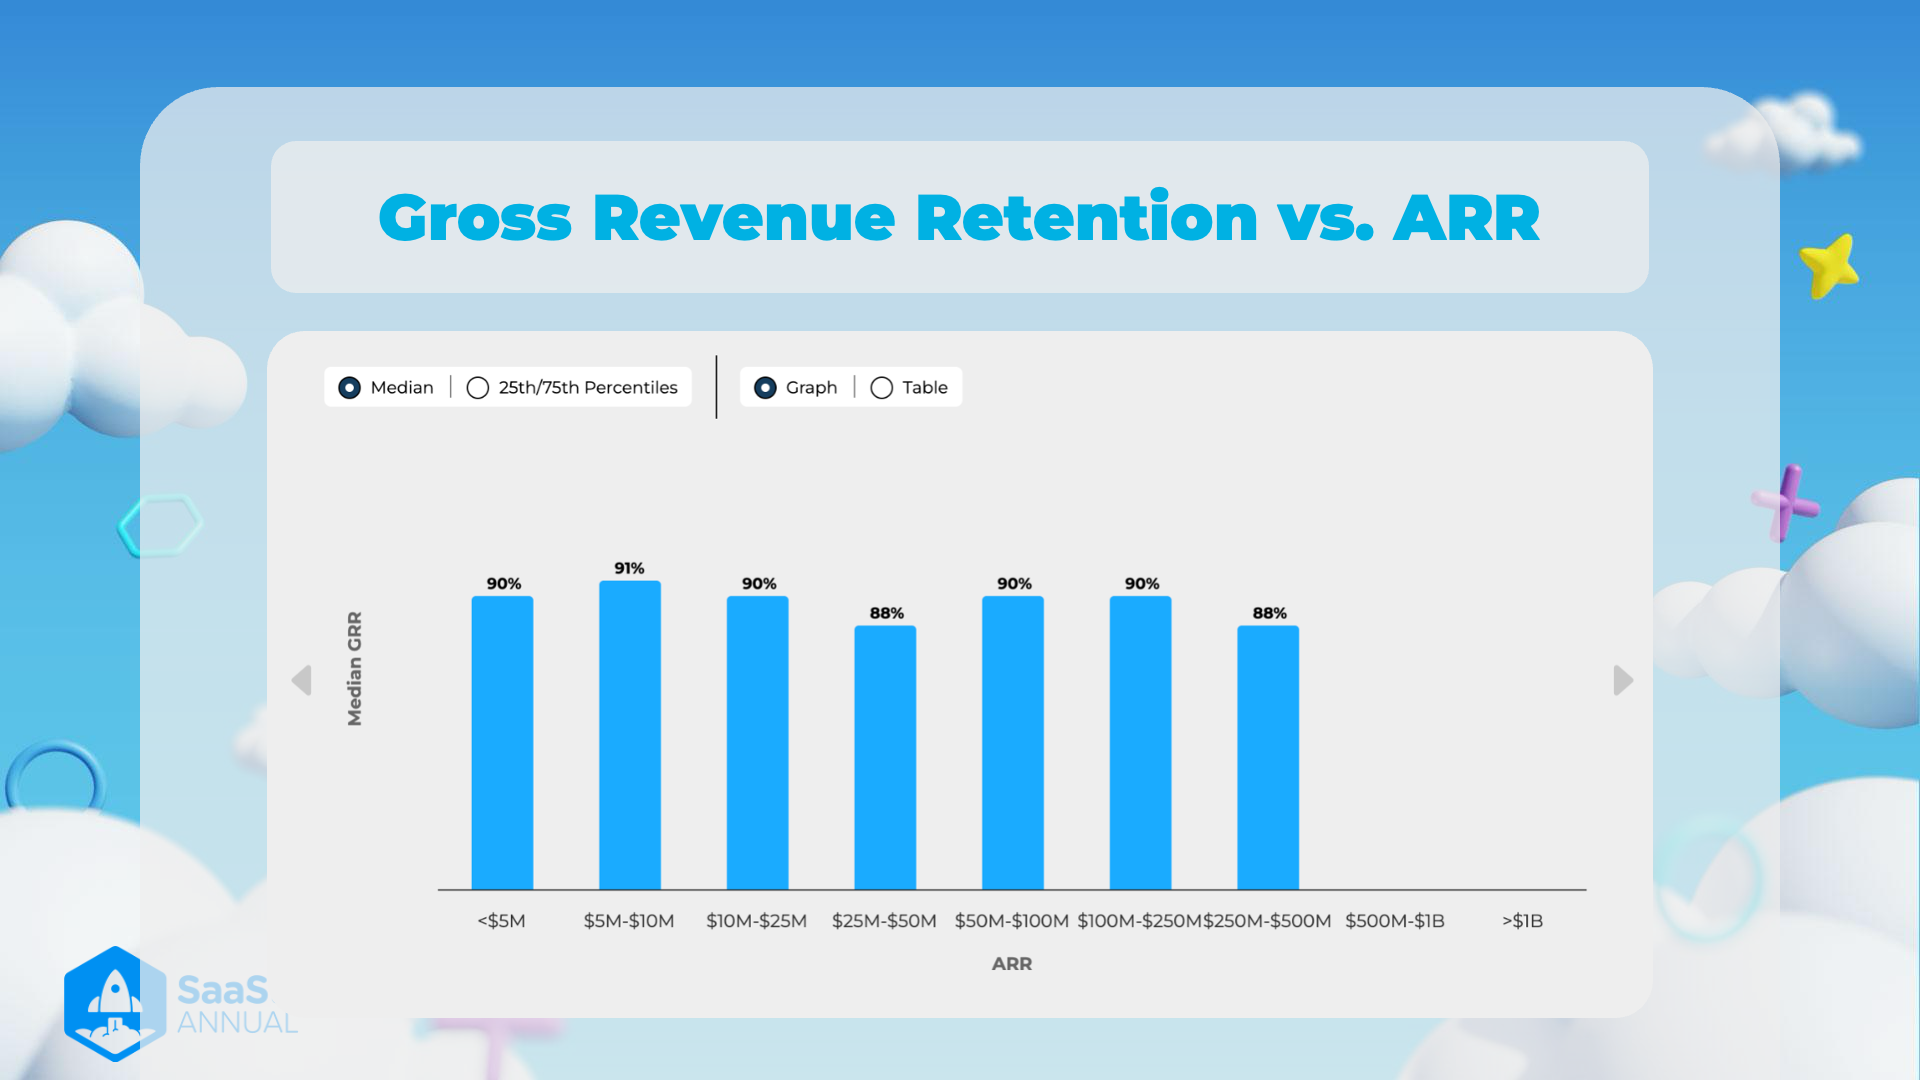
- This image presents a bar graph showcasing the relationship between Gross Revenue Retention (GRR) and Annual Recurring Revenue (ARR).
- The graph aims to provide insight into the median retention metrics across different ARR brackets.
Key Components
Labels
- Title: "Gross Revenue Retention vs. ARR"
- Clarifies the comparison metric being analyzed.
- Y-axis: "Median GRR"
- Represents the Median Gross Revenue Retention in percentage terms.
- X-axis: "ARR"
- Categories are divided into revenue brackets ranging from "<1B".
Data Points
- Median GRR by ARR Bracket
ARR Category Median GRR <$5M 90% 10M 91% 25M 90% 50M 88% 100M 90% 250M 90% 500M 88% 1B 90% >$1B 88% - The bars' heights indicate the different median GRR percentages for varying ARR brackets.
Additional Notes
- Legend:
- Median: The graph represents the median values for each ARR bracket.
- Graph/Table Toggle: Provides an option to switch between graphical and tabular representations for clarity.
- Options: Lightly highlighted options, such as viewing 25th/75th percentiles, suggest deeper data insight variables not currently showcased in the selected view.
Graph Patterns
- Most ARR brackets have a stable GRR percentage around 90%.
- This could indicate consistent revenue retention strategies across these segments.
- There's a slight dip to 88% GRR in the 50M and >$250M ARR segments.
- Companies in these ARR brackets might face unique challenges impacting revenue retention slightly more than others.
Visual Design
- The background with clouds adds a whimsical, light-hearted visual to the data presentation, likely intending to make the information more engaging.
- Visual elements, such as hexagons and stars, contribute to a tech-themed, innovative aesthetic.
- The "SaaS Annual" logo suggests that the data is related to a specific annual review or event focusing on the Software as a Service industry.
By understanding these key components and patterns, we can better understand the implications on SaaS businesses regarding revenue retention strategies at different revenue scales.
Reference:
85% Average Gross Retention
Key Points
Average Gross Retention
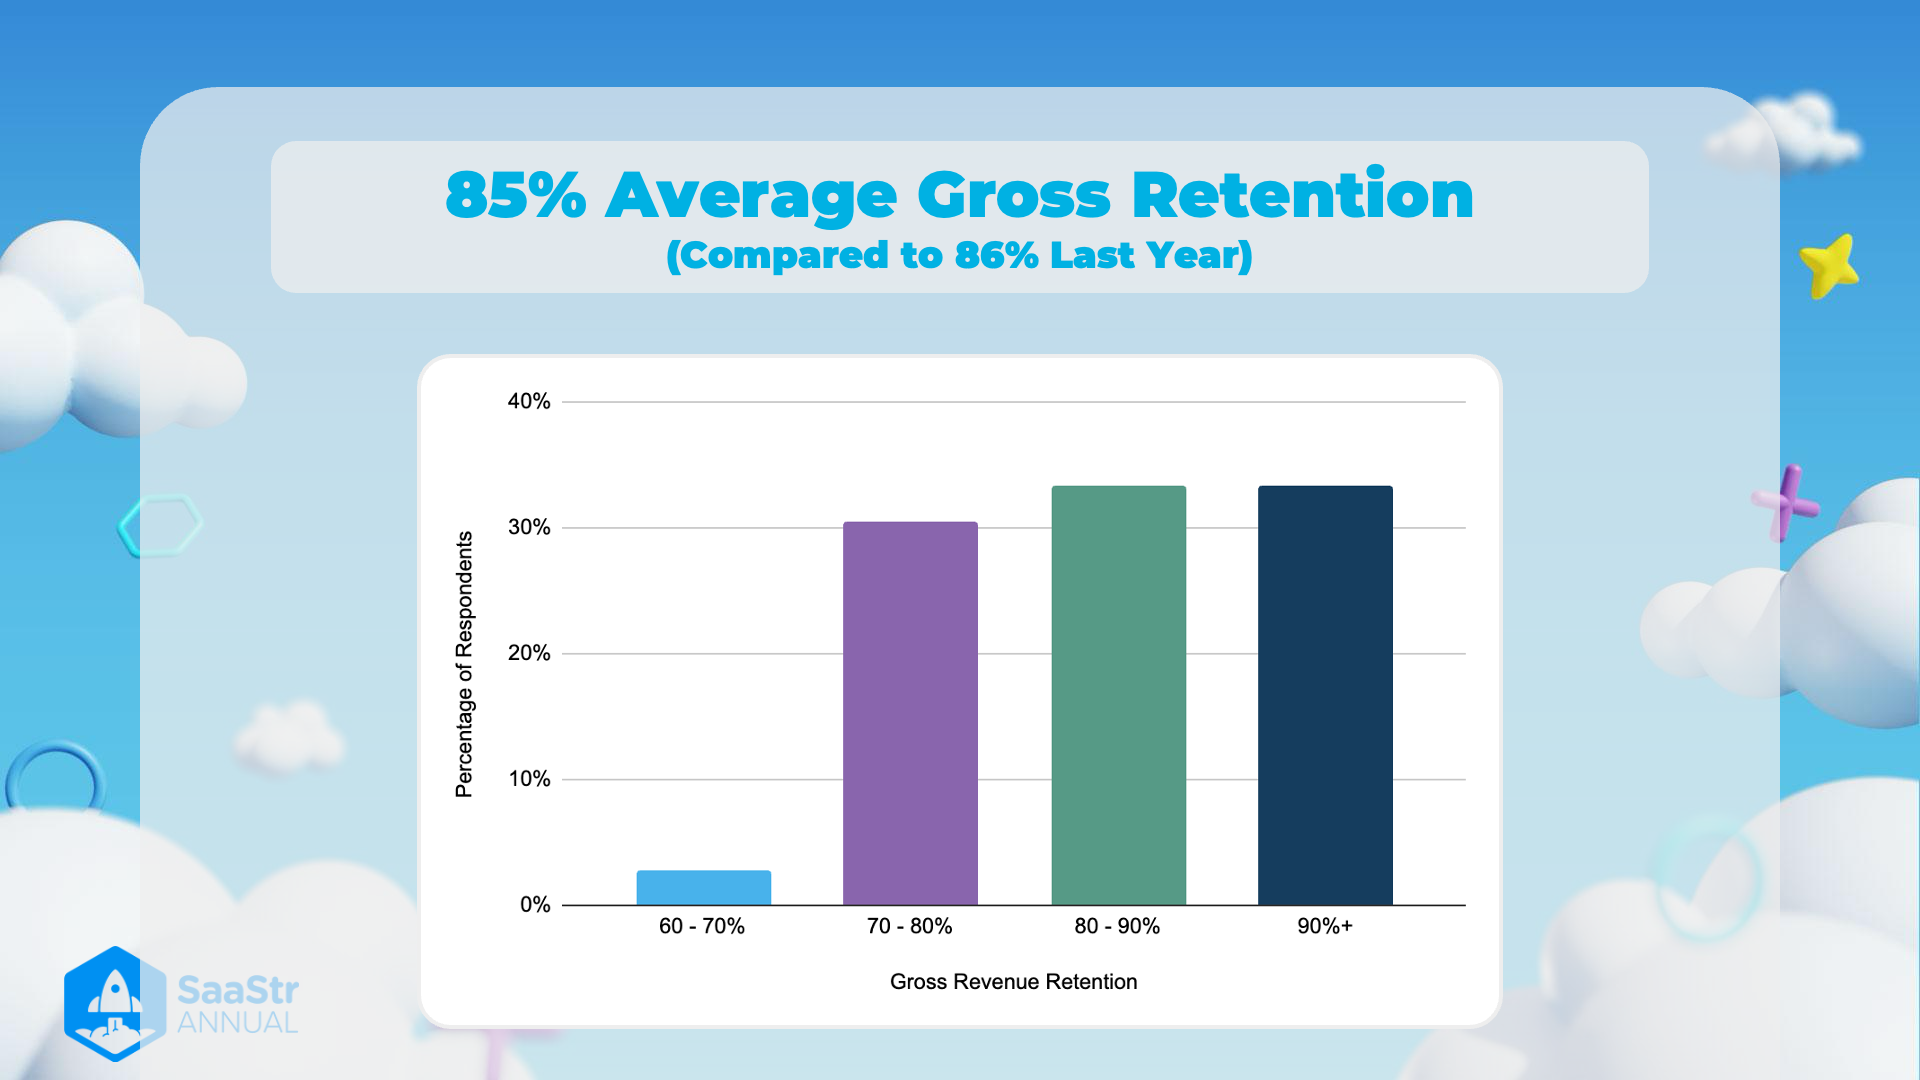
- Data Presented: The image showcases that the average gross retention rate is 85%.
- Comparison to Last Year: This rate is compared to last year's gross retention rate of 86%, indicating a slight decrease.
- Importance of Retention: Gross retention rate is crucial for SaaS (Software as a Service) companies as it reflects customer loyalty and potential for long-term revenue.
Distribution of Gross Revenue Retention Rates
- Categories: The chart breaks down the gross revenue retention rates into four categories:
- 60-70% : Smallest percentage of respondents.
- 70-80% : Second smallest percentage of respondents.
- 80-90% : Second highest percentage of respondents.
- 90%+ : Highest percentage of respondents.
- Explanation: This shows that most SaaS companies maintain a gross revenue retention rate above 70%, which indicates relatively high customer satisfaction and retention.
Visual Elements
- Graph Type: Bar graph representing different gross revenue retention rates.
- Color Coding: Each retention rate category is represented by a different color for easy distinction.
- Layout and Design: Graph is simple and clear with a blue-themed background indicative of the SaaS sector.
Source
- Brand Mention: The bottom left corner of the image credits "SaaStr Annual" as the source.
- Event Context: SaaStr Annual is a major event for SaaS companies, often sharing vital industry benchmarks and data.
Data Table
| Gross Revenue Retention | Percentage of Respondents |
|---|---|
| 60-70% | ~1% |
| 70-80% | ~23% |
| 80-90% | ~34% |
| 90%+ | ~36% |
Additional Thoughts
- Implication of High Retention Rates: Companies with retention rates above 90% might be leveraging excellent customer service, continuous product improvement, and effective customer success strategies.
- Strategic Focus: SaaS companies often focus on improving their gross retention rates through various customer engagement and retention strategies, such as upselling, cross-selling, and effective onboarding processes.
Conclusion
- Trend Analysis: Despite a slight drop from last year, the overall gross retention rate is still high, which is favorable for the SaaS industry.
- Strategic Importance: Retention rates can serve as a critical KPI (Key Performance Indicator) for assessing the health and long-term viability of SaaS businesses.
Reference:
SaaS Retention Analysis
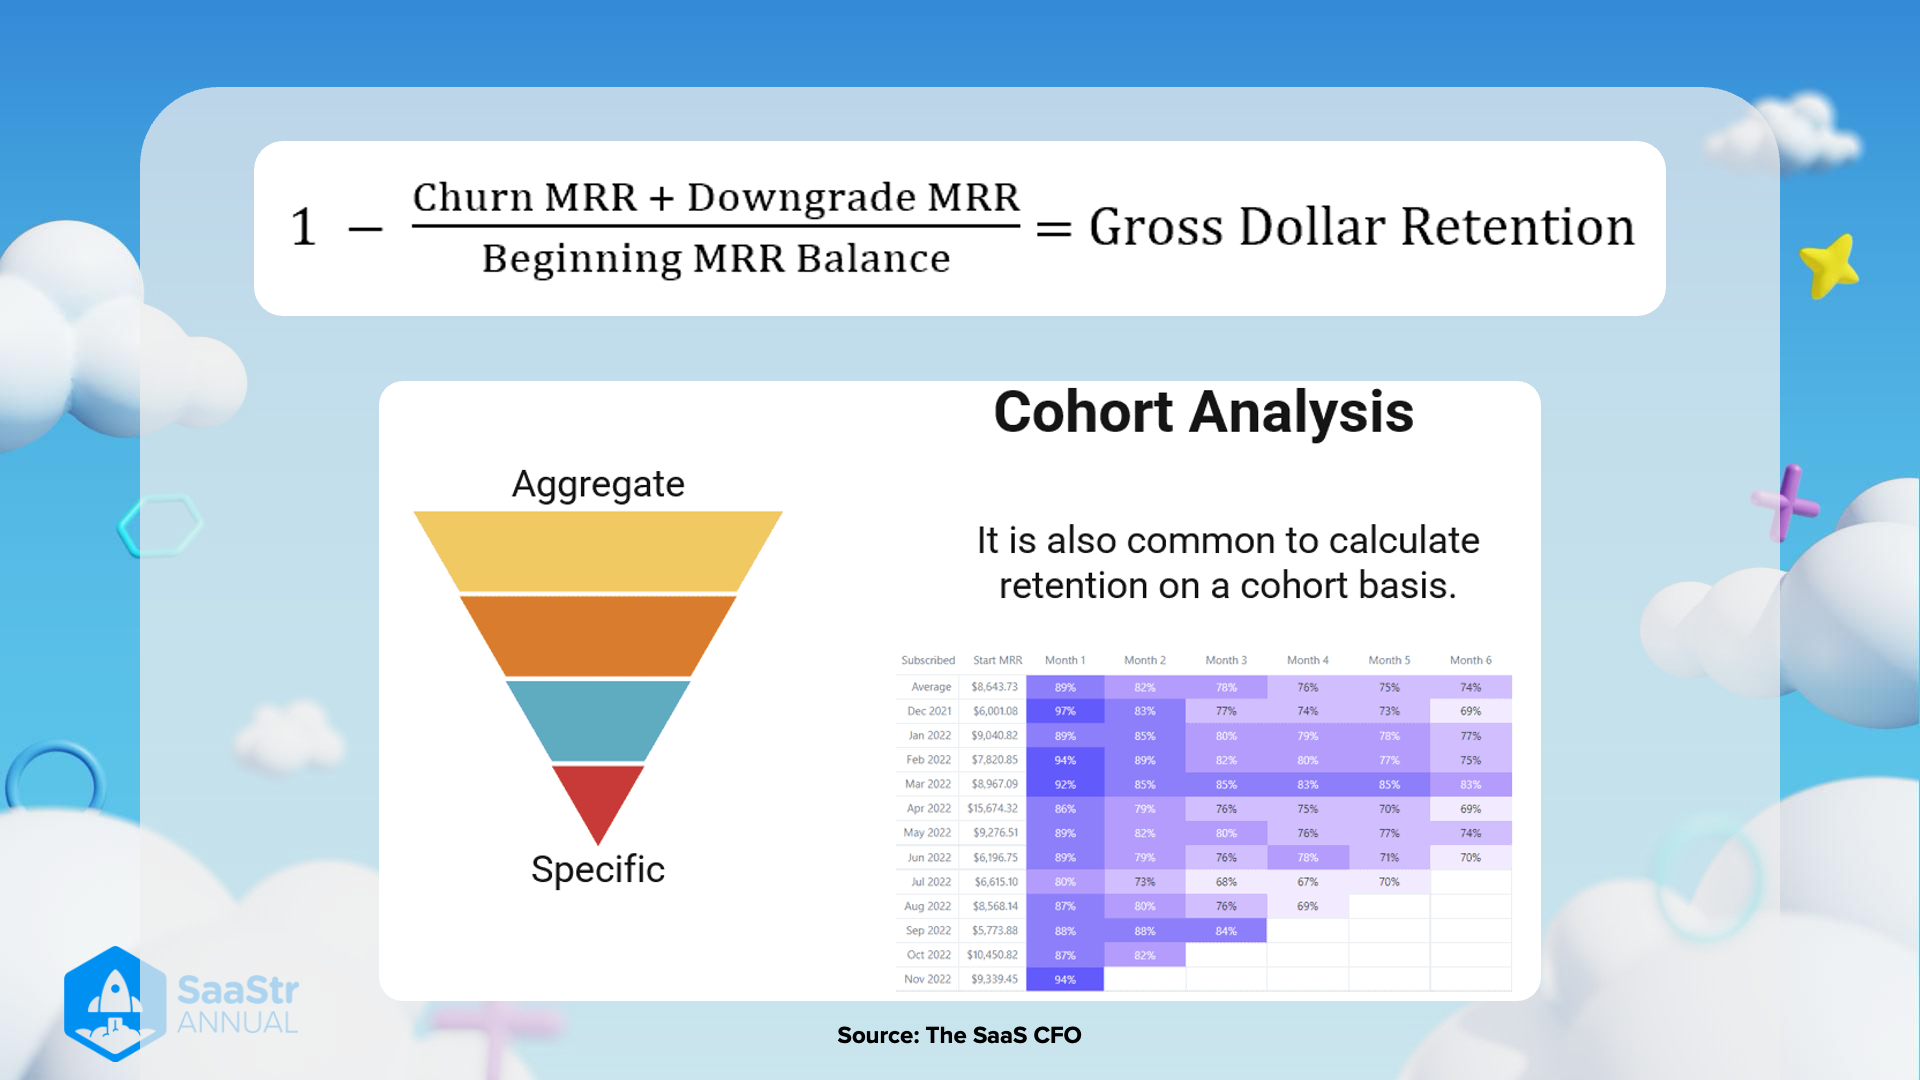
Gross Dollar Retention Calculation
Formula:
Thoughts:
- Gross Dollar Retention (GDR) measures how much of the recurring revenue is retained over a period without considering upgrades or expansions.
- High GDR indicates strong customer satisfaction and reduced churn rates, which are critical for the financial health of a SaaS company.
Funnel Analysis
Description:
- The funnel diagram demonstrates the transition from an aggregate view to a specific view.
- The purpose is to narrow down data to specifics for detailed analysis.
Thoughts:
- Aggregate Level: Provides an overall view of metrics, useful for high-level management and stakeholders.
- Specific Level: Offers detailed insights into specific segments, helping identify precise areas of improvement.
Cohort Analysis
Description:
- Caption: It is also common to calculate retention on a cohort basis.
Cohort Retention Data:
| Month | Average | Dec 2021 | Jan 2022 | Feb 2022 | Mar 2022 | Apr 2022 | May 2022 | Jun 2022 | Jul 2022 | Aug 2022 | Sep 2022 | Oct 2022 | Nov 2022 |
|---|---|---|---|---|---|---|---|---|---|---|---|---|---|
| Subscribed | - | - | - | - | - | - | - | - | - | - | - | - | - |
| Start MRR | $6,643.73 | $6,010.08 | $9,040.82 | $7,785.49 | $8,697.69 | $9,276.51 | $9,276.51 | $8,165.75 | $6,158.90 | $8,168.34 | $3,772.88 | $9,393.45 | |
| Month 1 | 89% | 97% | 93% | 82% | 92% | 81% | 80% | 83% | 81% | 87% | 92% | 86% | |
| Month 2 | 82% | 83% | 88% | 80% | 85% | 78% | 76% | 73% | 68% | 78% | 76% | 84% | |
| Month 3 | 78% | 77% | 83% | 77% | 85% | 75% | 74% | 67% | 67% | 69% | 70% | - | |
| Month 4 | 76% | 74% | 79% | 75% | 83% | 77% | 73% | 70% | 67% | 70% | - | - | |
| Month 5 | 75% | 73% | 78% | 75% | 77% | 75% | 71% | 71% | 70% | - | - | - | |
| Month 6 | 74% | 69% | 75% | 75% | 69% | 74% | 74% | 70% | - | - | - | - |
Thoughts:
- Cohort Analysis: This approach groups customers by a shared characteristic (e.g., the month they subscribed) and tracks their behavior over time.
- Application in Retention: Helps identify trends and patterns in customer retention, which can inform targeted strategies for improving customer satisfaction and reducing churn.
Additional Information:
- This analysis can reveal critical insights into how different customer segments retain over time and the effectiveness of retention strategies.
- The color shading in the table likely indicates the retention percentage more visually distinct, with darker shades showing higher retention rates.
Reference: