Advanced Statistical Methods Study Guide
Advanced Statistical Methods Notes
Part A: Short Questions
-
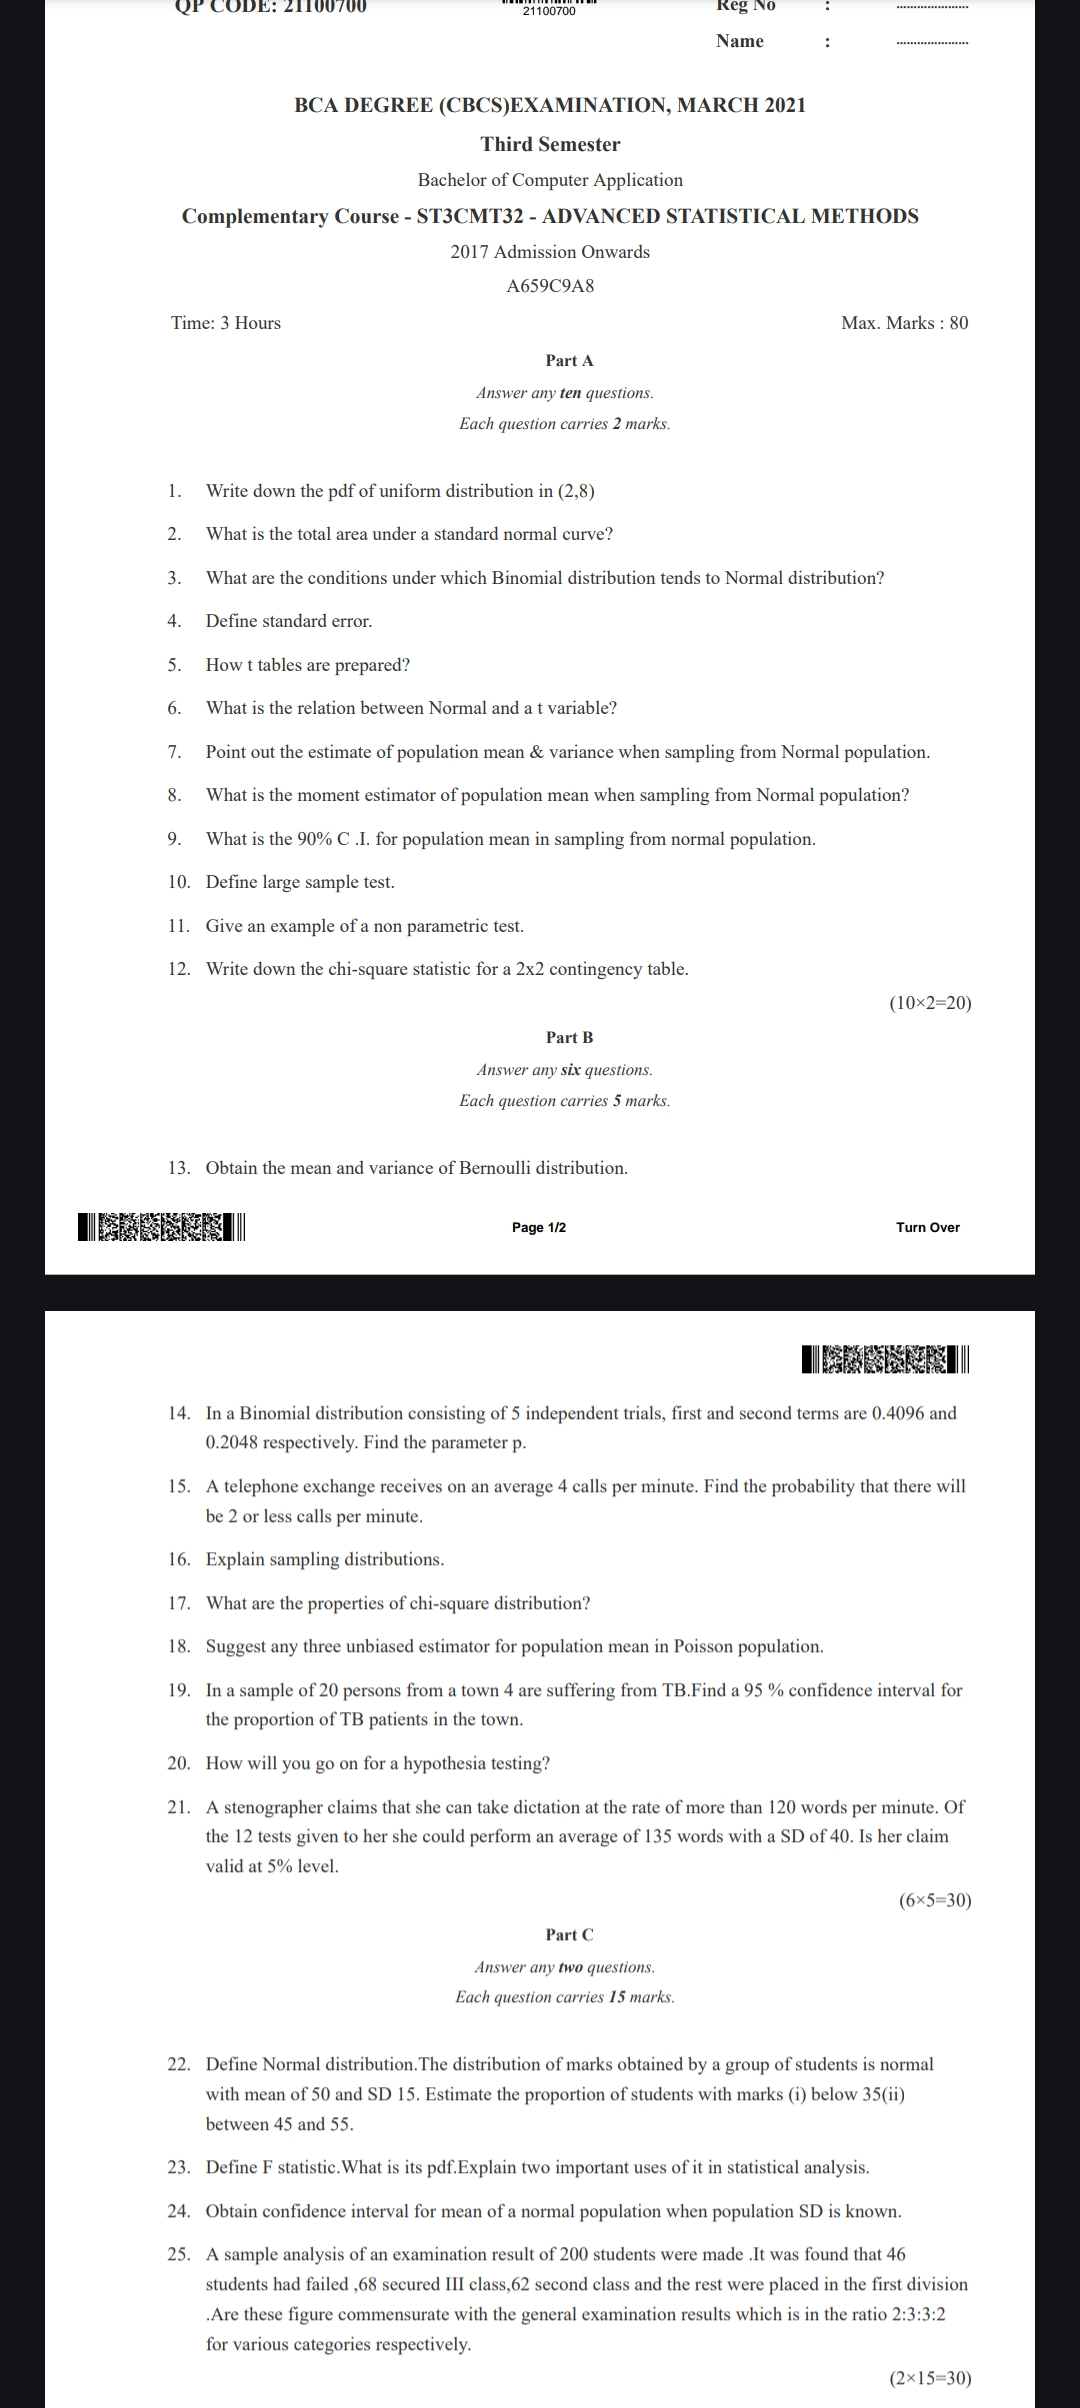
PDF of Uniform Distribution in (2,8)
- The probability density function (PDF) of a uniform distribution is constant between two intervals and zero outside. For interval (2,8), the PDF is .
-
Total Area Under a Standard Normal Curve
- The total area under the standard normal distribution curve is always 1. This signifies the total probability across all possible values.
-
Conditions for Binomial to Normal Distribution
- As per the Central Limit Theorem, a binomial distribution approaches a normal distribution when the number of trials is large and the probability of success is neither very small nor very close to 1.
-
Define Standard Error
- Standard error measures the variability or dispersion of the sample mean estimates of a population mean. It decreases with an increase in sample size.
-
Preparation of T Tables
- T tables are constructed based on the t-distribution, which accounts for samples and small sample sizes drawn from a normally distributed population.
-
Relation Between Normal and T Variable
- A t-distribution approaches a normal distribution as the sample size increases. T-distribution is used when the sample size is small and population variance is unknown.
-
Population Mean & Variance Estimator in Normal Sampling
- The sample mean is an unbiased estimator of the population mean, and sample variance estimates the population variance.
-
Moment Estimator of Population Mean
- Moment estimation involves using sample moments to estimate population parameters, typically using equations derived from the expected values of powers of the random variable.
-
90% Confidence Interval for Population Mean (Normal Sampling)
- This interval estimates the range within which the true population mean is likely to lie with 90% confidence, derived from the sample mean and standard error.
-
Define Large Sample Test
- These tests are employed when the sample size is sufficiently large, making the sampling distribution approximately normal due to the Central Limit Theorem.
-
Example of Non-Parametric Test
- The Mann-Whitney U test is an example, which is used to determine if there are differences between two independent groups.
-
Chi-Square Statistic for 2x2 Contingency Table
- Chi-square tests assess the independence of categorical variables. For a 2x2 table, the formula uses observed and expected frequencies to calculate the statistic.
Part B: Longer Questions
-
Mean and Variance of Bernoulli Distribution
- The mean is and the variance is , where is the probability of success on a single trial.
-
Find Parameter p in Binomial Distribution
- Utilize the formula for binomial probabilities to solve for based on given conditions.
-
Probability in Poisson Process (Calls)
- Utilize the Poisson probability formula for calculating probabilities of events over intervals.
-
Explain Sampling Distributions
- A sampling distribution shows the probability distribution of a statistic obtained from a large number of samples drawn from a specific population.
-
Properties of Chi-Square Distribution
- Non-negative, skewed to the right, and primarily used for tests of independence and goodness-of-fit.
-
Unbiased Estimators for Poisson Population Mean
- Suggestions include the sample mean, which is unbiased for the Poisson parameter .
-
Confidence Interval for TB Proportion
- Use confidence interval formulas involving the sample proportion and z-scores to calculate interval estimates.
-
Hypothesis Testing Procedure
- Steps include stating hypotheses, selecting significance level, calculating test statistic, and making a decision based on critical values.
-
Validate Stenographer's Claim (Hypothesis Test)
- Involves testing the null hypothesis using given sample data against the claimed average, using a significance level of 5%.
Part C: Essay Questions
-
Define Normal Distribution
- Normal distribution is a continuous probability distribution characterized by a symmetric bell-shaped curve defined by its mean and standard deviation (SD).
-
Define F Statistic
- The F statistic is used in ANOVA tests to compare variances. Its PDF is based on the F-distribution, useful in comparing group means.
-
Confidence Interval for Mean of Normal Population
- With known SD, the formula is , where is the sample mean, is the z-score, and is the population SD.
-
Examination Results Analysis
- This involves assessing whether the observed results align with expected ratios using hypotheses and statistical tests for categorical data.
This structured approach captures important statistical concepts and methods, aiding in understanding core statistical analysis techniques.
Extended readings:
Advanced Statistical Methods Notes
Part A: Short Questions
-
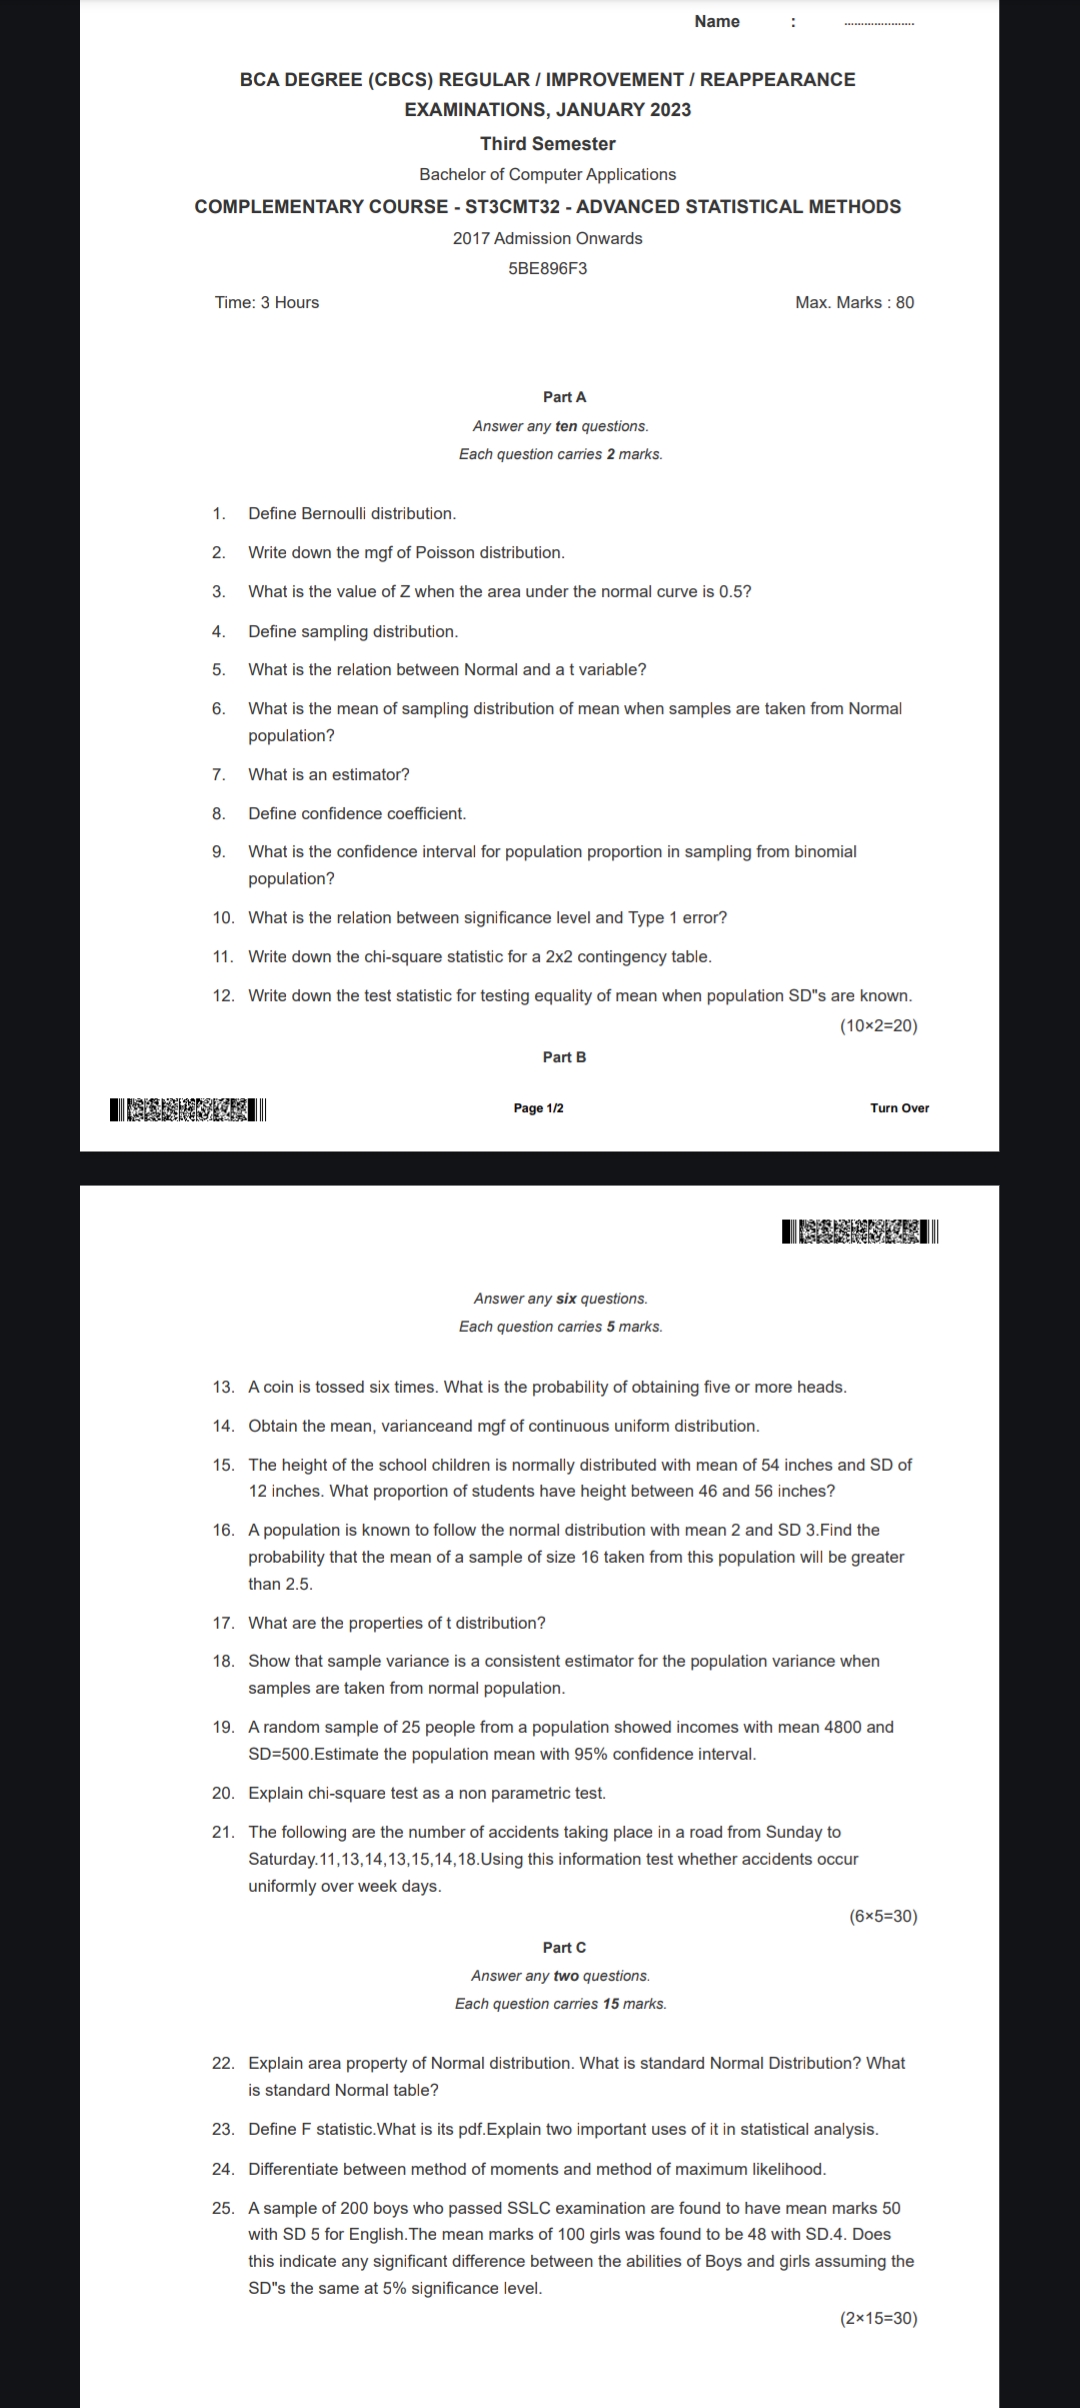
Define Bernoulli Distribution
- A discrete probability distribution for a random variable which takes only two possible outcomes, usually 0 (failure) or 1 (success). Commonly used for binary outcomes.
-
MGF of Poisson Distribution
- The moment-generating function (MGF) for a Poisson distribution with parameter λ is . It's used to derive moments like mean and variance.
-
Value of Z When the Area Under the Normal Curve is 0.5
- The Z-value is 0, indicating the mean in a standard normal distribution. This is because the curve is symmetric around the mean.
-
Define Sampling Distribution
- A probability distribution of a statistic (like the mean) obtained from a large number of samples drawn from a specific population. Important for understanding the variability of sample statistics.
-
Relation Between Normal and T Variable
- The t-distribution converges to the normal distribution as sample size increases. Useful for small sample sizes.
-
Mean of Sampling Distribution of Mean from Normal Population
- The mean of the sampling distribution equals the population mean (μ). Known as an unbiased estimator.
-
What is an Estimator?
- A statistic used to infer the value of an unknown parameter in a statistical model.
-
Define Confidence Coefficient
- The probability that a confidence interval contains the true population parameter. It’s commonly set at 0.95.
-
Confidence Interval for Population Proportion in Binomial Sampling
- Typically calculated as , where is the sample proportion, Z is the Z-value for the desired confidence level, and n is the sample size.
-
Relation Between Significance Level and Type 1 Error
- Significance level (α) is the probability of making a Type 1 error – rejecting a true null hypothesis.
-
Chi-Square Statistic for a 2x2 Contingency Table
- , where O is observed frequency and E is expected frequency. Used for independence tests.
-
Test Statistic for Testing Equality of Means with Known Population SDs
- Often uses the Z-test when population standard deviations are known.
Part B: Long Questions
-
Probability of 5 or More Heads When a Coin is Tossed Six Times
- Calculate using binomial probability: .
-
Mean, Variance, and MGF of Continuous Uniform Distribution
- Mean: , Variance: , MGF: .
-
Proportion of Students with Height Between 46 and 56 Inches
- Use the standard normal distribution to find probabilities corresponding to these Z-scores.
-
Normal Distribution Probability for Sample Mean Greater Than 2.5
- Calculate using Z-transform of sample mean: .
-
Properties of T Distribution
- Symmetric, bell-shaped, heavier tails than normal. As sample size increases, it approaches a normal distribution.
-
Sample Variance as Consistent Estimator
- Demonstrates that as sample size increases, sample variance approaches population variance.
-
95% Confidence Interval for Population Mean
- , where is sample mean, is standard deviation, and n is sample size.
-
Explain Chi-Square Test as a Non-Parametric Test
- Tests for independence and goodness of fit. Does not assume a normal distribution.
-
Testing Uniform Occurrence of Accidents Over Days
- Use chi-square test for uniform distribution of frequencies among categories.
Part C: Essay Questions
-
Area Property of Normal Distribution & Standard Normal Table
- Standard normal distribution has mean 0 and variance 1. Tables provide cumulative probabilities for Z-values.
-
Define F Statistic
- Ratio of variances – used in ANOVA for testing equality of means. Its PDF helps compare variability between group means.
-
Methods of Moments vs Maximum Likelihood
- Methods of moments equate sample moments to population moments, while maximum likelihood estimates parameters by maximizing likelihood function.
-
Analysis of Boys and Girls Mean Marks
- Perform a two-sample t-test to check for significant differences in means, assuming equal population variances.
These notes cover the key concepts in statistical distributions, hypothesis testing, and estimation methods. Understanding these elements is crucial for analyzing data effectively.
Extended readings: