Exam Notes: Risk Management and Investment Strategies
Families of Functions and Curves
Fundamental Concepts
Absolute Value Graphs
- Graph of :
- Reflects the portion of the graph of that lies below the x-axis over the x-axis.
- Example: Obtain the graph of from .
Sketching Graphs
- Problems:
- Sketch
- Sketch:
Greatest Integer Function
- Definition: The greatest integer function gives the greatest integer less than or equal to .
- Examples:
- Examples:
Function Composition and Commutativity
- Commutativity: Check if for non-constant functions.
- If yes, find examples.
- If no, demonstrate why not.
Quick Check Answers
-
Function Operations:
- ;
- ;
- ;
- ;
-
Composition:
- ;
- ;
-
Vectors Movements: Right; 2; Up; 1.
-
True/False:
- (a) W
- (b) Yes
Families of Functions
Overview
- Definition: Functions are grouped into families based on their defining formulas or common characteristics.
Families of Curves
-
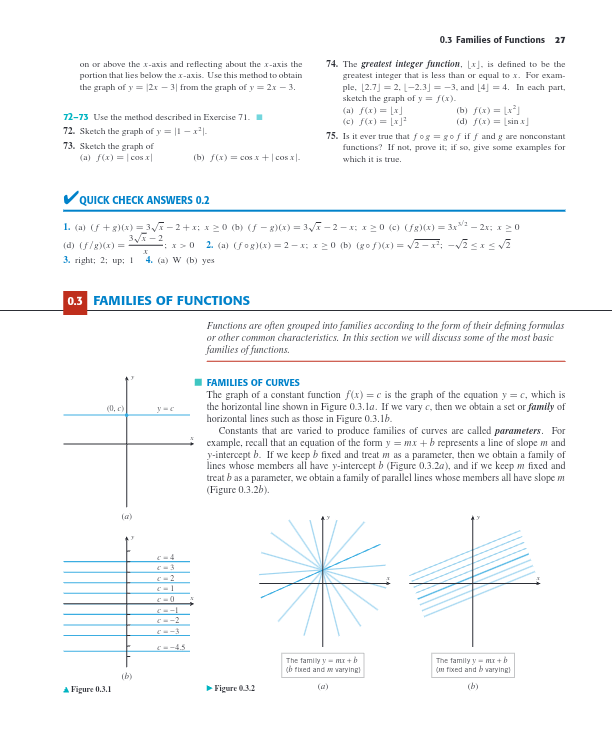
Constant Function Graph: is represented as a horizontal line.
- Example: forms horizontal lines when varies.
-
Parameters: Constants varied to create families of curves.
- Example:
- Linear equation:
- Keeping constant:
- Family of Lines Slope
- Keeping constant:
- Family of Parallel Lines Intercept
- Example:
Figures
-
Figure 0.3.1:
- Horizontal lines with various values of .
-
Figure 0.3.2:
- Curves with varying parameters and :
- (a) with fixed and varying .
- (b) with fixed and varying .
- Curves with varying parameters and :
Extended readings:
Power Functions: The Family ( y = x^n )
Definition of Power Functions
- A function of the form , where is constant, is called a power function.
- We consider cases where is a positive integer.
Graphical Representation
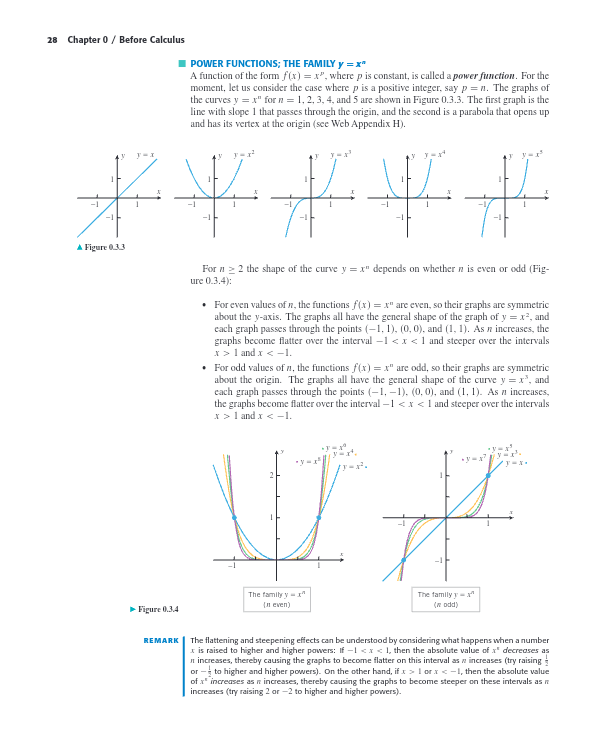
The graphs for the curves for and show distinct characteristics:
- : A straight line with slope 1 through the origin.
- : A parabola that opens upward with its vertex at the origin.
Shape of the Curve for
The shape of the curve depends on whether is even or odd:
Even Values of
- Symmetry: Graphs are symmetric about the y-axis.
- Shape: Resemble the graph of .
- Key Points: Pass through , , and .
- Behavior: As increases, graphs flatten over the interval and become steeper for and .
Odd Values of
- Symmetry: Graphs are symmetric about the origin.
- Shape: Resemble the graph of .
- Key Points: Pass through , , and .
- Behavior: Similar flattening and steepening as even , flattening over and steepening for and .
Remark on Flattening and Steepening
- Interval :
- As increases, the absolute value of decreases, causing graphs to flatten.
- Interval or :
- As increases, the absolute value of increases, causing graphs to steepen.
This understanding of power functions is crucial for calculus, as it helps in analyzing the behavior of polynomial functions and their derivatives. The symmetry and transformation properties lay the foundation for more complex mathematical concepts.
Extended readings:
Families of Functions
The Family
Graph Shape and Properties
-
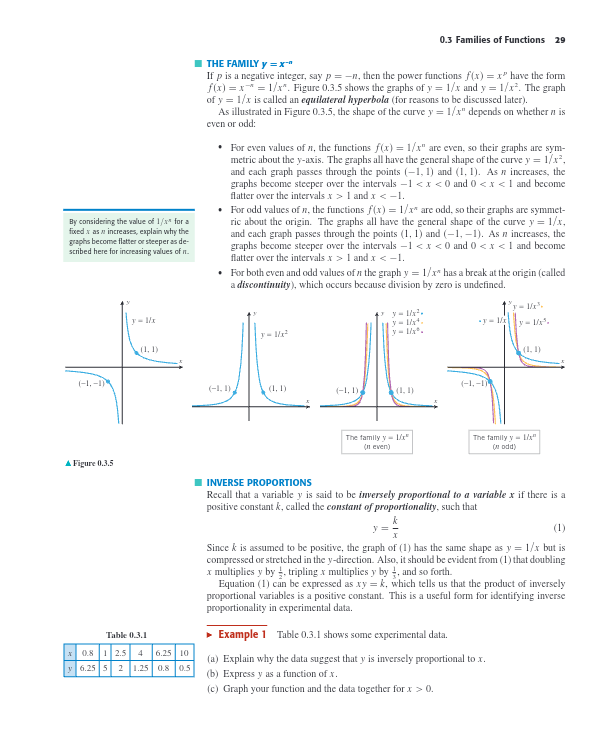
Even :
- Functions are even and symmetric about the -axis.
- General shape resembles .
- Pass through points and .
- As increases, graphs become steeper for and , but flatter for and .
-
Odd :
- Functions are odd and symmetric about the origin.
- General shape resembles .
- Pass through points and .
- As increases, graphs become steeper for and , but flatter for and .
-
Discontinuity:
- Both even and odd exhibit a break at the origin because division by zero is undefined.
Insight
- Symmetry helps predict the graph's behavior when altering .
- Visualizing changes in steepness provides an understanding of function rates and limits.
Inverse Proportions
-
Definition:
- A variable is inversely proportional to a variable if there is a positive constant such that .
-
Behavior:
- Graphs are similar in shape to but can be compressed or stretched.
- If doubles, becomes half; if triples, becomes one-third, etc.
-
Equation Relation:
- Expressed as , indicating the product of the variables is a constant.
Insight
- Understanding inverse relationships is vital in real-world applications, such as physics and economics.
- The relationship simplifies identification and computation.
Example Analysis
Table 0.3.1
| 0.8 | 6.25 |
| 2.5 | 2 |
| 4 | 1.25 |
| 6.25 | 1 |
| 10 | 0.8 |
| 0.5 | 10 |
-
(a) Data Analysis:
- The product remains constant, suggesting is inversely proportional to .
-
(b) Function Expression:
- , where is a constant matching product values from the table.
-
(c) Graphing:
- Plot and the given data for to visualize inverse proportionality.
Insight
- Analyzing tables for inversely proportional data increases comprehension of how variables interact.
- Graphs offer visual confirmation of mathematical relationships.
By understanding these mathematical concepts and relationships, we can interpret and predict various real-world phenomena.
Extended readings:
Notes on Inverse Proportion and Power Functions
Inverse Proportion
-
Definition: An inverse proportion between two variables and means for a constant . This implies that if one variable increases, the other decreases proportionally.
-
Example:
- Equation: Given , then .
- Graph: The graph is a hyperbola, shown in Figure 0.3.6, demonstrating inverse proportionality by the curve bending towards the axes as or increases.
-
Boyle's Law:
- Statement: States that if a fixed amount of an ideal gas is held at a constant temperature, the product of the pressure and volume is constant, .
- Graph: Illustrated in Figure 0.3.7, showing the inverse relationship, where doubling the pressure halves the volume.
Power Functions with Noninteger Exponents
-
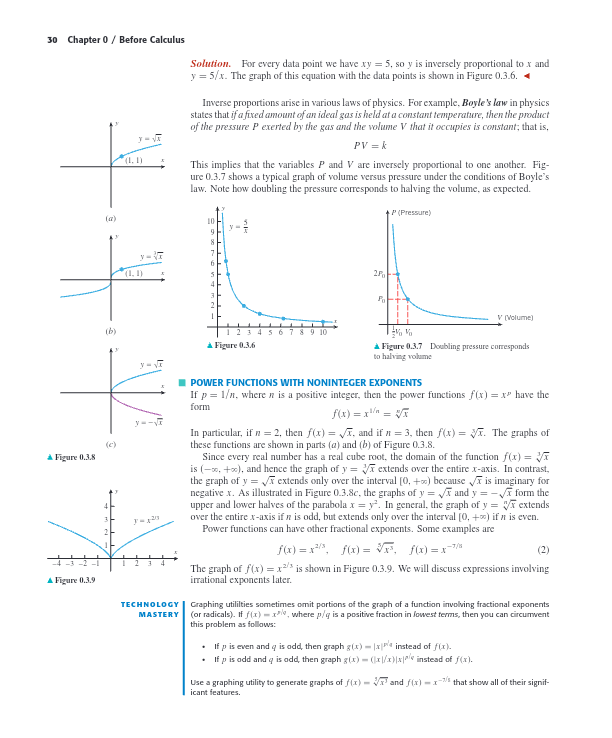
General Form: If , where is a positive integer, then .
-
Special Cases:
-
- Domain: because square roots of negative numbers are imaginary.
- Graph: Extends only over non-negative .
-
- Domain: since cube roots are defined for all real numbers.
- Graph: Extends over the entire -axis.
-
-
Graph Behavior:
- For and , the graphs form the upper and lower halves of a parabola (Figure 0.3.8c).
- Power functions with odd extend over the entire -axis, while those with even only extend over non-negative .
-
Examples with Fractional Exponents:
-
- Graph: Figure 0.3.9 shows this function.
- Other examples: .
-
Technology Mastery
-
Graphing Utilities:
- May omit portions due to complexity with fractional exponents.
- Solutions:
- If is even and is odd, use .
- If both and are odd, use .
-
Practice: Use graphing utilities to visualize functions like and , capturing all significant features.
Extended readings:
Polynomials and Rational Functions
Polynomials
- Definition: A polynomial in is a function expressible as a sum of terms , where is a constant and is a nonnegative integer.
- Examples:
- (can be represented as )
Key Concepts
- Coefficients: Constants in the expressions.
- Degree: The highest power of with a nonzero coefficient. Polynomials can have the following degrees and corresponding names:
- Linear: Degree 1, e.g.,
- Quadratic: Degree 2, e.g.,
- Cubic: Degree 3, e.g.,
- Quartic: Degree 4, e.g.,
- Quintic: Degree 5, e.g.,
- Zero Polynomial: Considered to have an undefined degree.
- Natural Domain: All polynomials have a natural domain of ; however, their behavior varies by degree.
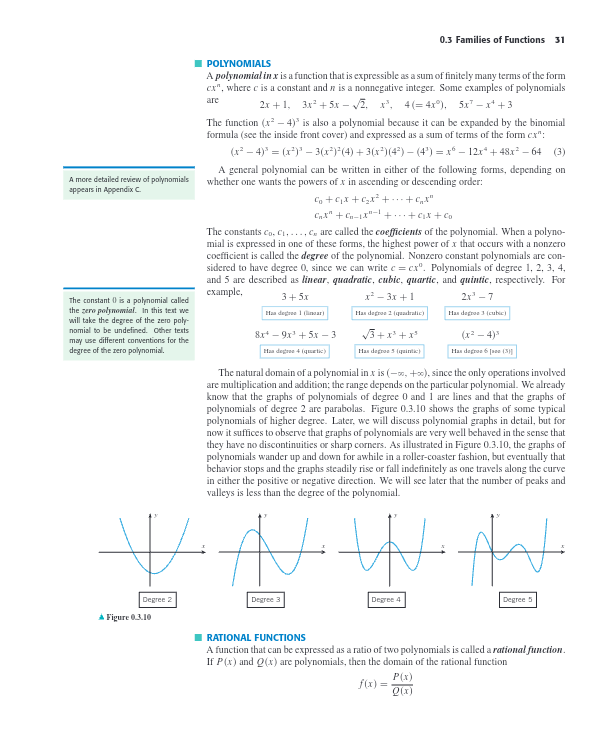
Polynomial Graphs
- Characteristics: Smooth curves without discontinuities or sharp corners.
- Behavior: Exhibits a wave-like pattern with peaks and valleys, degree has fewer than peaks/valleys.
- Graph Shapes:
- Degree 0 and 1: Line
- Degree 2: Parabola
- Higher degrees: More complex curves

- Degree 2, 3, 4, and 5 Graphs: Represent typical polynomial graphs of increasing complexity.
Rational Functions
- Definition: A function expressed as the ratio of two polynomials, .
- Components:
- and are polynomials.
- Domain Note: Excludes values where .
Additional Insights
- Polynomial Expansion: Terms like can be expanded using binomial formulas.
- Roots and Behavior: Graphs of polynomials mirror underlying equations, reflecting root multiplicity and leading coefficient influence on end behavior.
By understanding fundamentals like polynomial degrees, coefficients, and graph behavior, complex functions like rational functions become more comprehensible.
Extended readings: