Data Trends and Analysis of cm/s² Measurements
Notes on Data Table
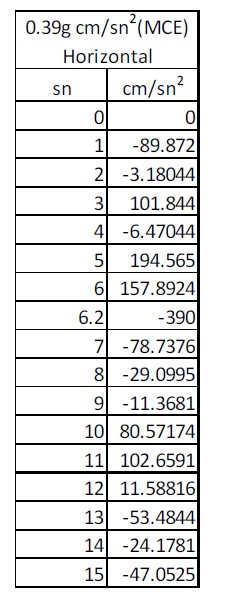
The image contains a data table related to measured values expressed in (MCE) under horizontal conditions. Below is an extracted summary of the information presented in the table.
Extracted Data
| sn | cm/s² |
|---|---|
| 0 | 0 |
| 1 | -89.872 |
| 2 | -3.18044 |
| 3 | 101.844 |
| 4 | -6.47044 |
| 5 | 194.565 |
| 6 | 157.8924 |
| 6.2 | -390 |
| 7 | -78.7376 |
| 8 | -29.0995 |
| 9 | -11.3681 |
| 10 | 80.57174 |
| 11 | 102.6591 |
| 12 | 11.58816 |
| 13 | -53.4844 |
| 14 | -24.1781 |
| 15 | -47.0525 |
Analysis and Thoughts
-
Data Description:
- The table lists the "sn" (probably a sample number or identifier) alongside their corresponding measurements in .
- Observing the values, it appears that some entries are negative while others are positive.
-
Trends:
- There are notable fluctuations in the measurements, with some extremely high or low values (e.g., -390 and 194.565).
- This could indicate variability in the data collection process or differences in the conditions during measurement.
-
Zero Reference Point:
- The first entry (sn = 0) serves as a baseline reference (0 cm/s²).
- Understanding the context of why other values deviate from this point could provide insight into the phenomena being measured.
-
Negative Values Significance:
- Negative values may indicate a reversal of expected motion or could reflect data that require further interpretation.
- It's essential to explore what negative acceleration could imply within the specific context of this study or application.
-
Further Research:
- Additional context (such as conditions under which these measurements were taken) could enhance understanding.
- It may be worthwhile to gather further data or conduct repeat measurements to confirm or clarify these results.
-
Units and Interpretation:
- Measurements are in , suggesting an acceleration context; clarity on whether this data pertains to physical motion or another application (like fluid dynamics) would be beneficial.
Understanding these aspects could greatly contribute to better interpreting the results and enhancing any research or application connected to these measurements.