Understanding Uniform (Rectangular) Distribution
Uniform or Rectangular Distribution
Definition
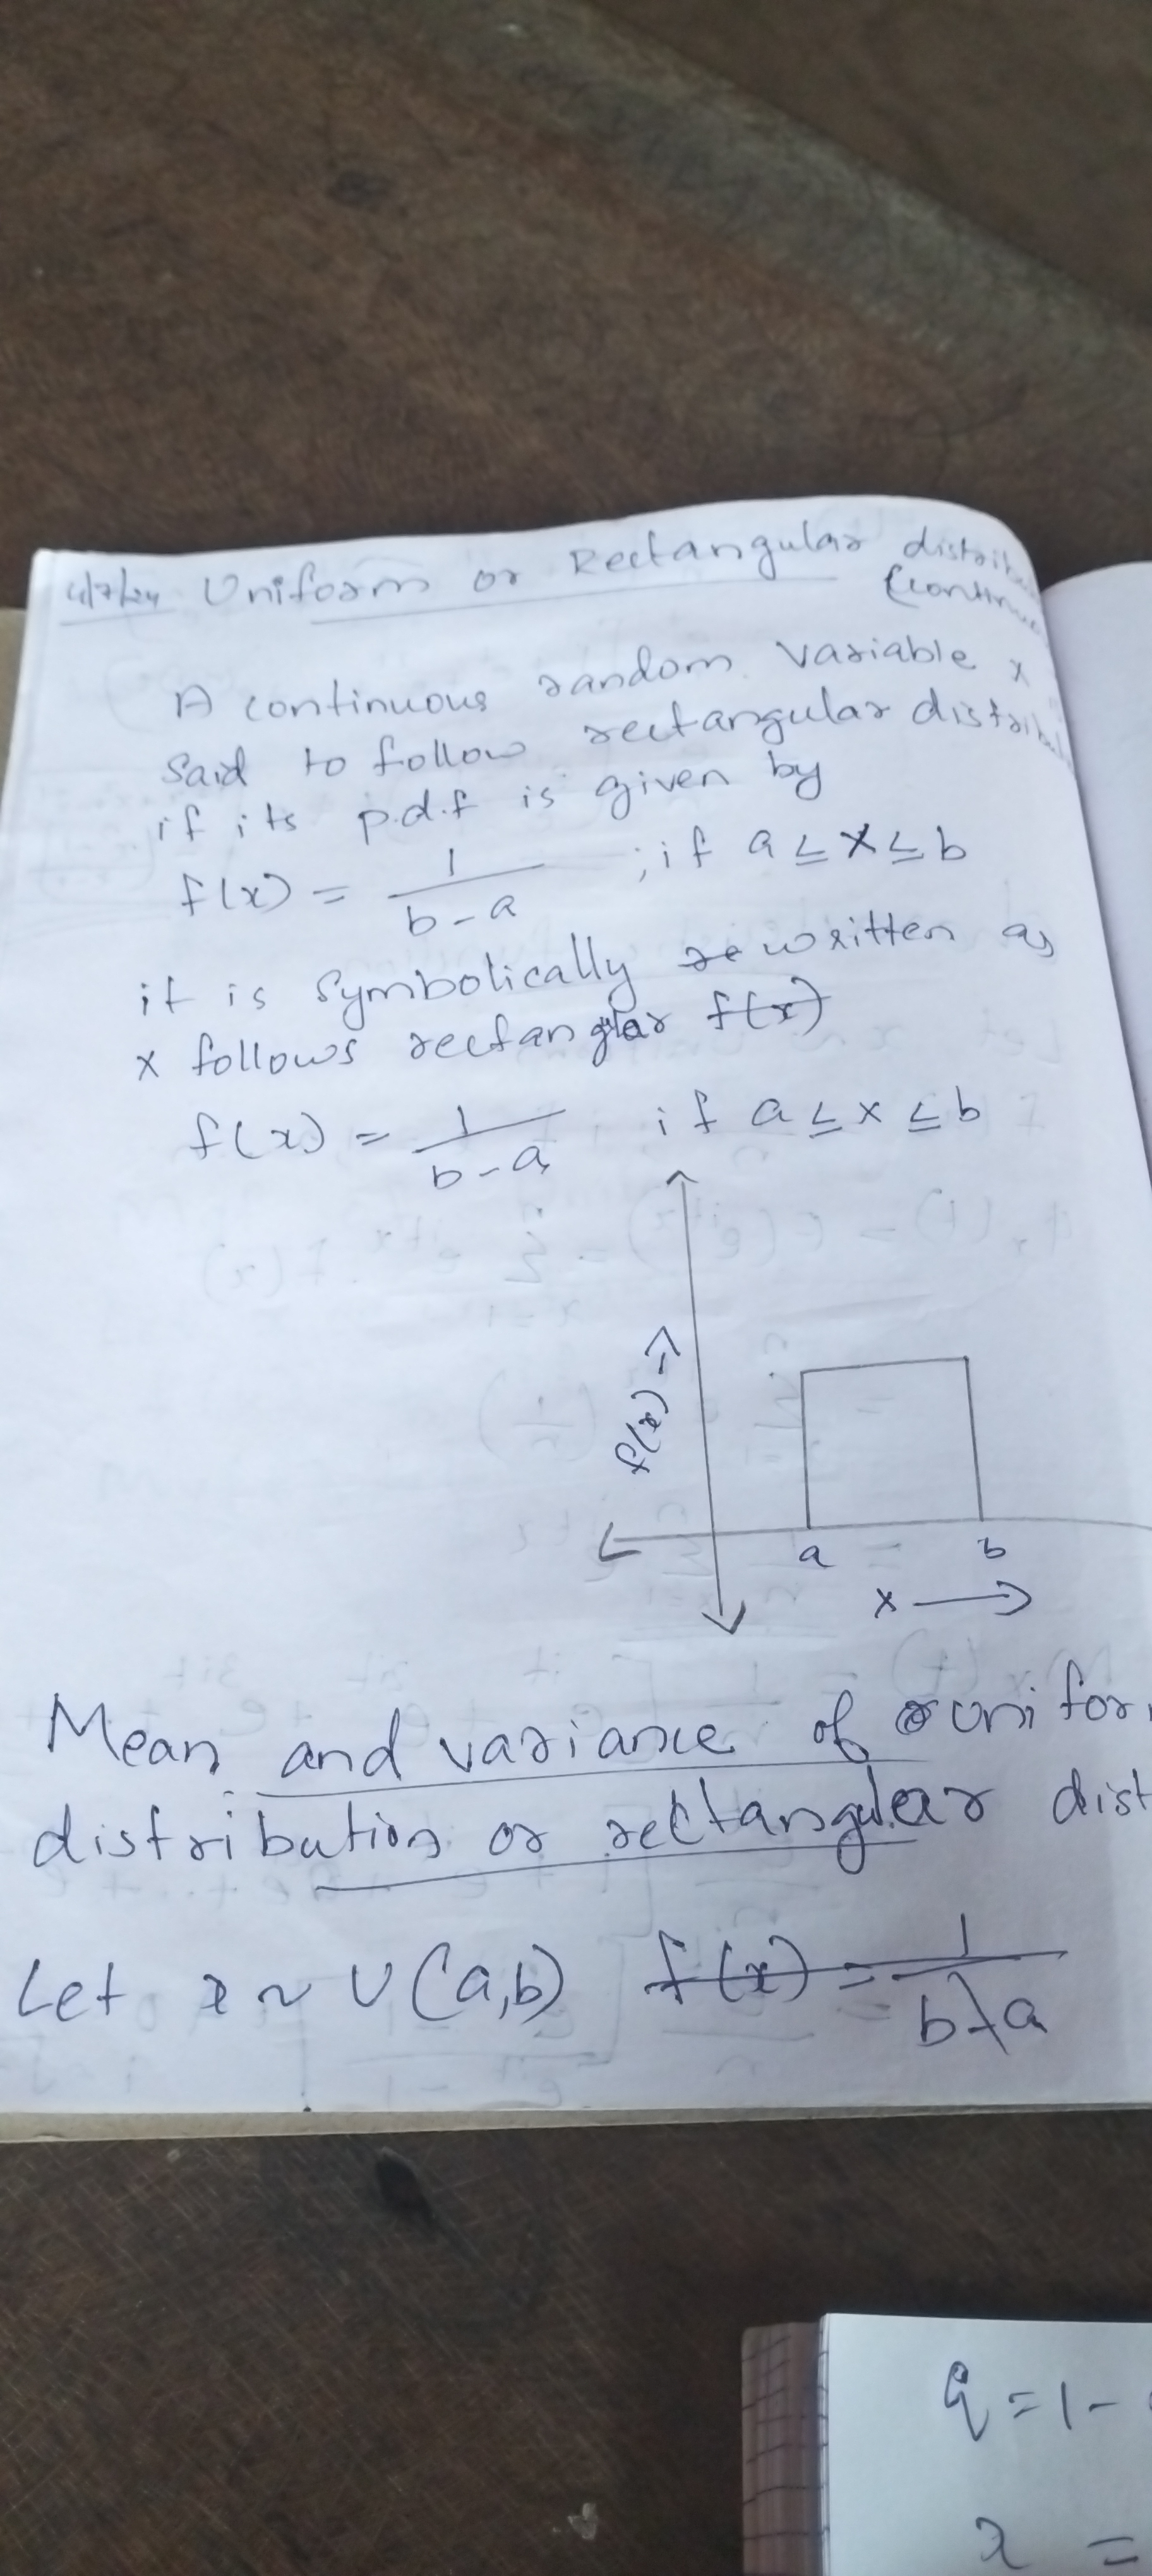
A continuous random variable is said to follow a rectangular (uniform) distribution if its probability density function (pdf) is given by:
Insight:
- This function describes a constant probability over the interval $$$a, b]$.
- Outside of this range, the probability is zero.
Notation
It is symbolically written as .
Insight:
- The notation signifies a uniform distribution over the interval .
Graphical Representation
The graph of is a rectangle:
- Height:
- Base:
Mean and Variance
For a uniform distribution :
Insight:
- The mean is the midpoint of the interval .
Insight:
- The variance measures the spread of the distribution.
- It is derived from the average of squared deviations from the mean.
Additional Information
- Applications: This distribution is commonly used in simulations and modeling scenarios where each outcome in the interval is equally likely.
- Properties: It is symmetric around the mean, has finite variance, and is easy to integrate due to its constant density function over the interval.
Conclusion: Understanding uniform distribution is key for analyzing scenarios where outcomes are equally probable over a specified range.
Extended readings:
en.wikipedia.org
Continuous uniform distribution - Wikipedia
stats.libretexts.org
4.3: Uniform Distributions - Statistics LibreTexts
www.ucd.ie
\[PDF$$ Statistics: Uniform Distribution (Continuous)