SaaStr 2024 - Key Customer Success Topics for Investor Discussions
Net Promoter Score Explanation
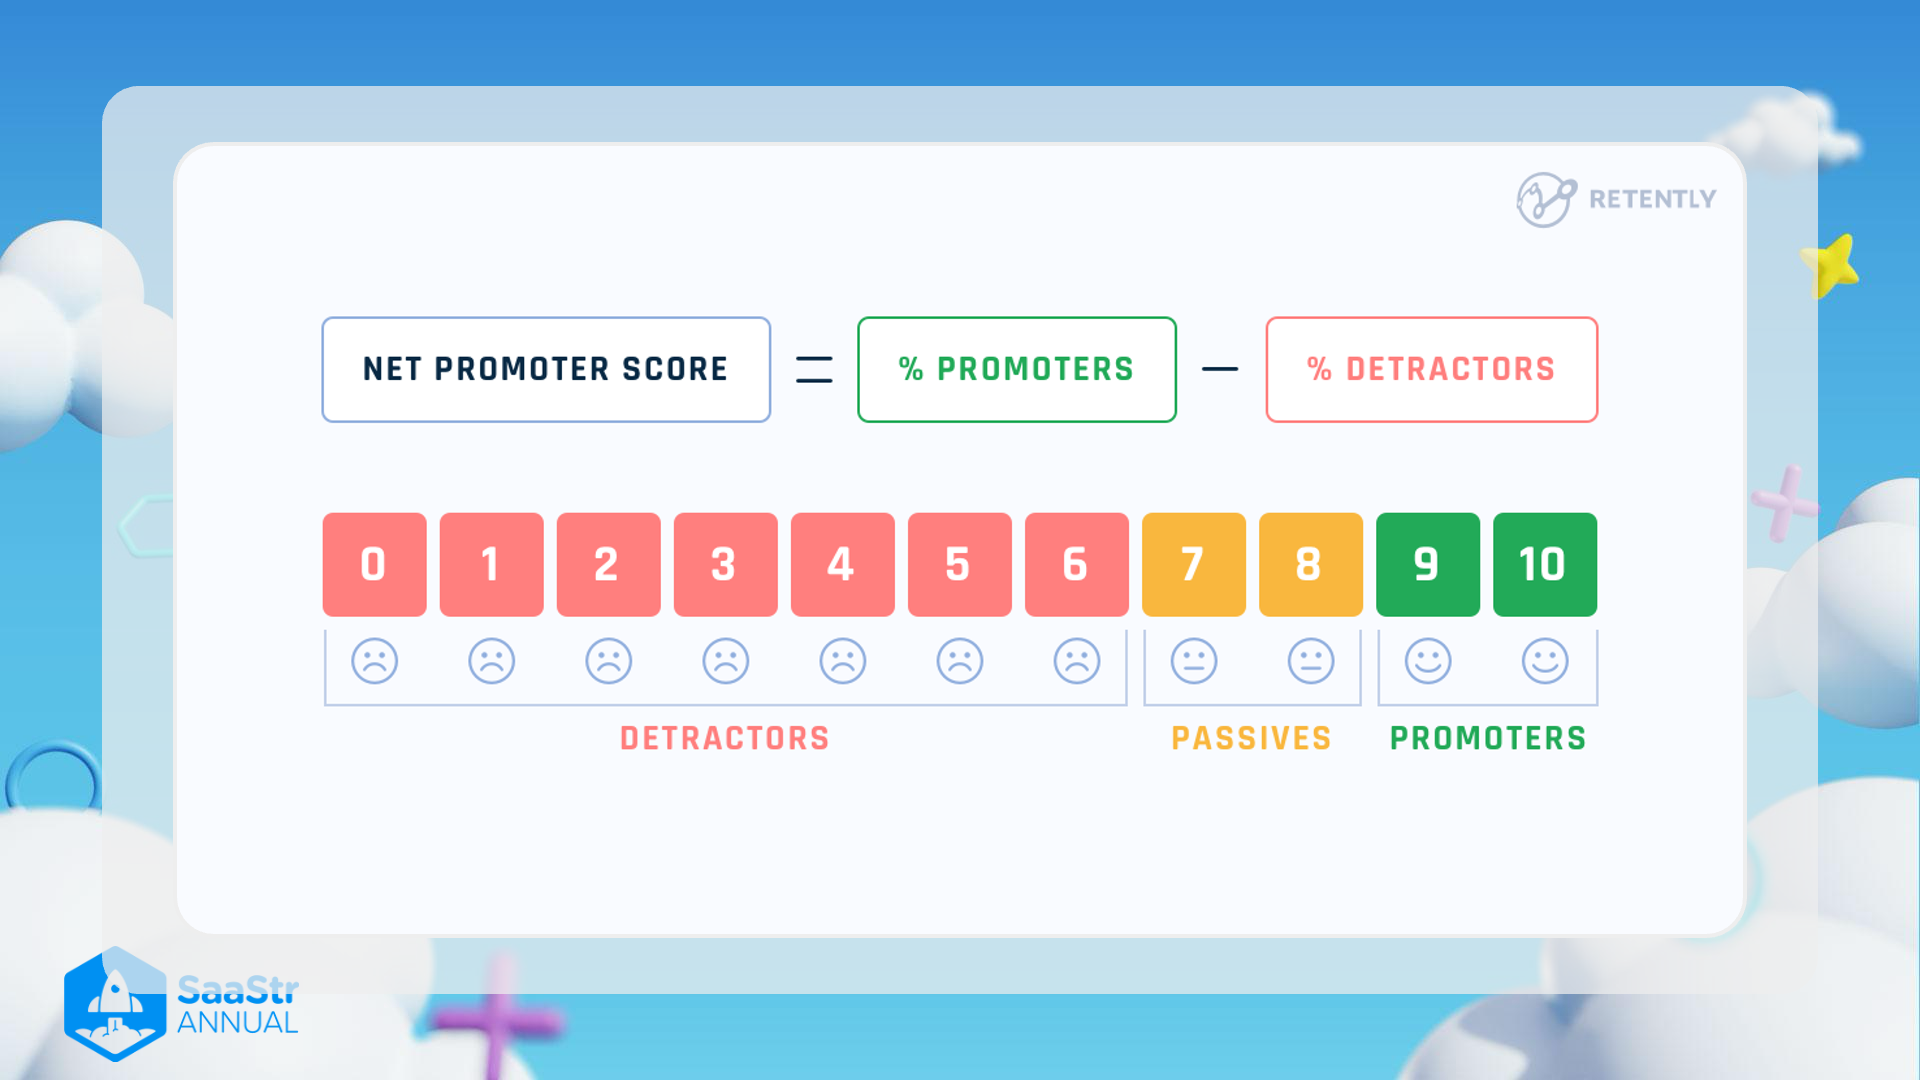
Overview
The image provides a visual explanation of the Net Promoter Score (NPS) framework, a widely used metric to gauge customer loyalty and satisfaction.
Components of the NPS Formula
NPS = % Promoters – % Detractors
- % Promoters: The percentage of respondents who rate the product or service a 9 or 10. These are highly satisfied customers likely to recommend the company.
- % Detractors: The percentage of respondents who rate the product or service between 0 and 6. These customers are dissatisfied and unlikely to recommend the company.
Rating Scale
- Detractors (0-6) :
- 0: Very Dissatisfied
- 1: Very Dissatisfied
- 2: Dissatisfied
- 3: Dissatisfied
- 4: Neutral
- 5: Neutral
- 6: Neutral
- These ratings are negatively viewed and indicate that the customer is unhappy with the product or service.
- Passives (7-8) :
- 7: Neutral
- 8: Satisfied but not enthusiastic
- These ratings are not included in the NPS calculation but can indicate areas for improvement.
- Promoters (9-10) :
- 9: Very Satisfied
- 10: Extremely Satisfied
- These ratings indicate that the customer is very happy with the product or service and is likely to recommend it.
Interpretation and Use
- NPS is a critical indicator of customer loyalty and future growth potential.
- High scores mean more Promoters than Detractors, signaling strong customer satisfaction.
- Low scores, with more Detractors, indicate widespread dissatisfaction.
Additional Points
- Application: Commonly used in surveys, the NPS question is typically: "On a scale of 0 to 10, how likely are you to recommend our product/service to a friend or colleague?"
- Insights: Regular tracking of NPS helps businesses understand customer perceptions and make improvements. Trends can reflect changes in customer satisfaction over time.
Summary Table
| Rating Range | Category | Description |
|---|---|---|
| 0-6 | Detractors | Dissatisfied customers, likely to provide negative feedback |
| 7-8 | Passives | Neutral customers, satisfied but not enthusiastic |
| 9-10 | Promoters | Highly satisfied customers, likely to recommend |
By using this framework, businesses can effectively measure and enhance customer satisfaction and loyalty.
Reference:
Early Warning Scores
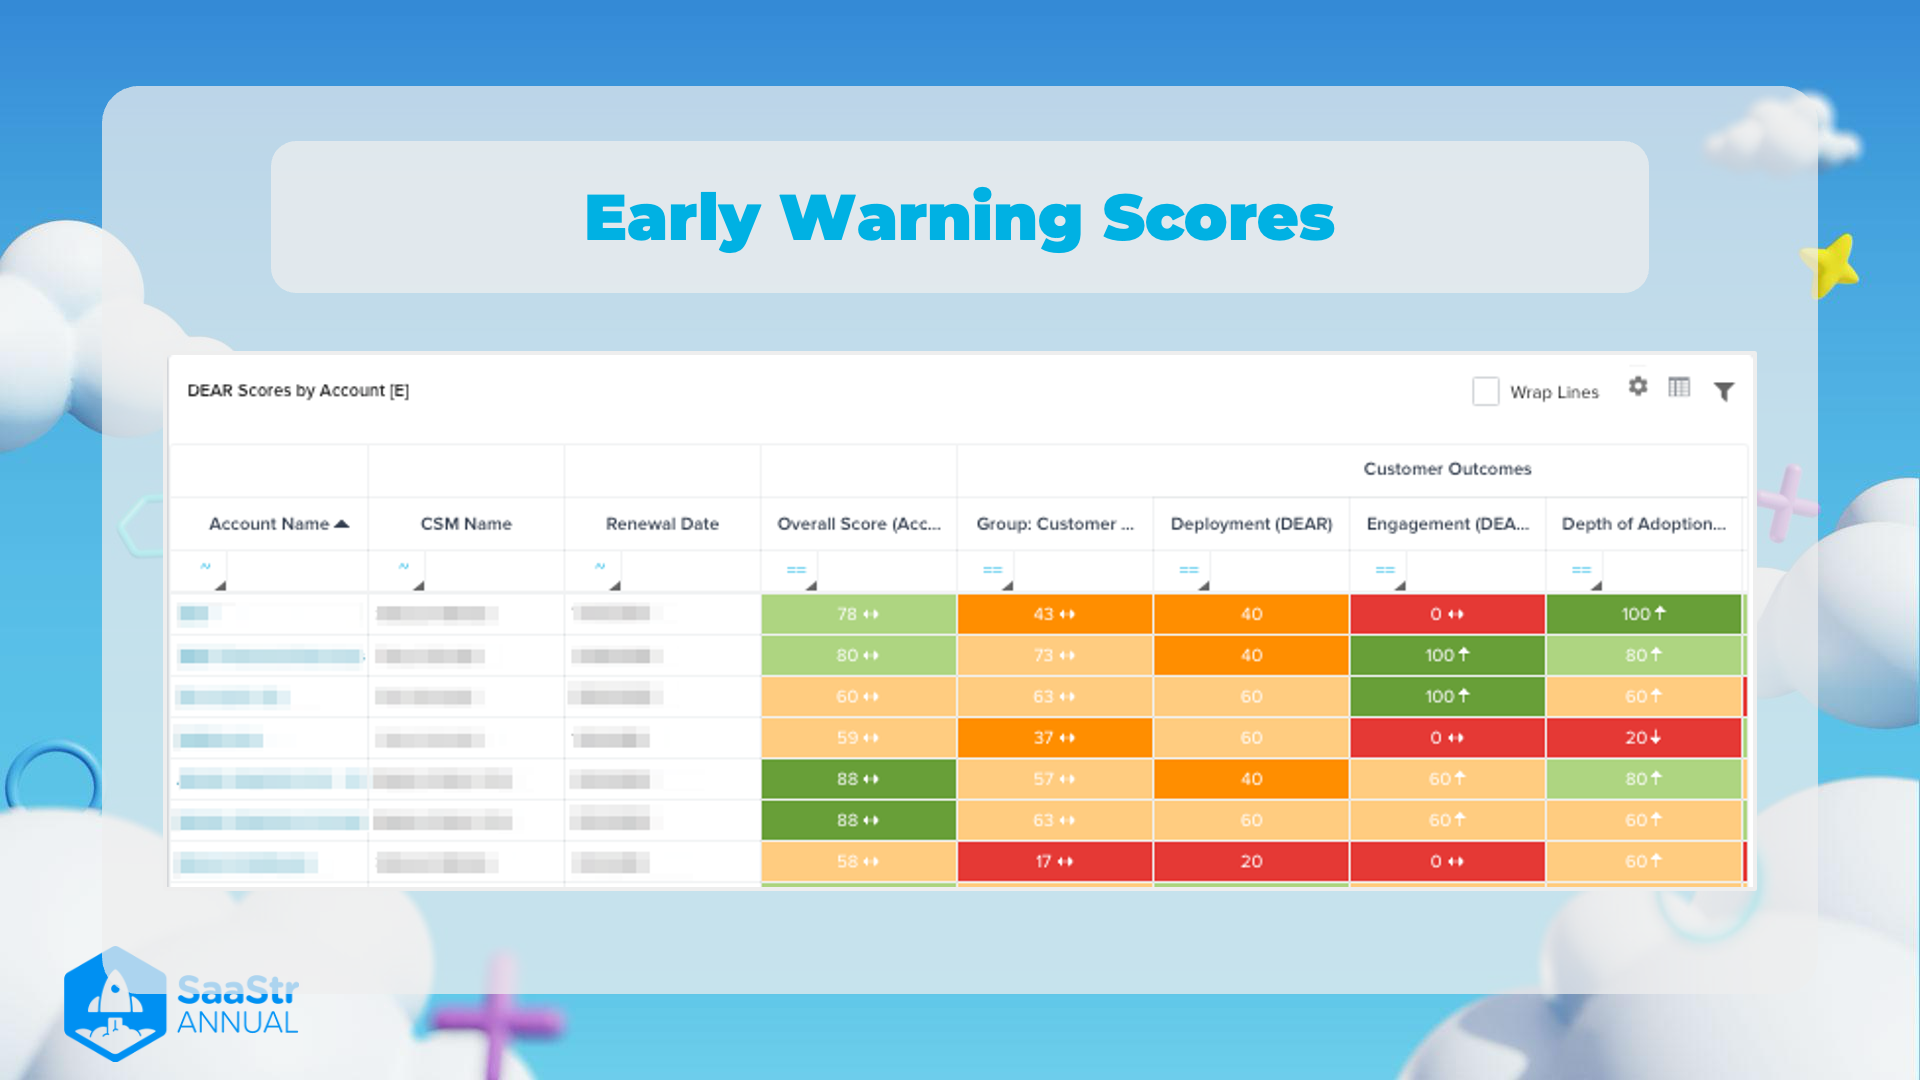
The image showcases a dashboard intended to monitor and score customer health through various metrics, known as DEAR Scores. The table helps identify potential risks in customer relationships by providing early warning scores. Here's a detailed breakdown:
General Information
- Title: Early Warning Scores
- Purpose: To monitor customer health and identify at-risk accounts by assessing different performance metrics.
- Platform: SaaStr Annual
Table Breakdown
The table titled "DEAR Scores by Account" incorporates various columns that assess and score customer health on different parameters. The table includes the following information:
Column Headers
-
Account Name
- Identifies the customer or client account.
-
CSM Name
- Customer Success Manager associated with the account.
-
Renewal Date
- Date when the client's contract is due for renewal.
-
Overall Score (Account Health)
- A composite score representing the overall health and satisfaction level of the account. Color-coded for quick visualization:
- Green indicates higher scores and healthier accounts.
- Yellow and red suggest lower scores and potential issues.
- A composite score representing the overall health and satisfaction level of the account. Color-coded for quick visualization:
-
Group: Customer Sentiment
- Customers' general perception and sentiment towards the service or product.
-
Deployment (DEAR)
- Indicates the extent to which the product/service has been deployed across the customer’s intended use-cases or departments.
-
Engagement (DEAR)
- Measures how actively the customer is interacting with the product/service.
- Higher scores reflect more active engagement.
-
Depth of Adoption (DEAR)
- Represents how deeply the customer has integrated the product/service into their workflows.
- Higher scores signify broader and deeper usage.
Sample Data
| Account Name | CSM Name | Renewal Date | Overall Score (Account Health) | Group: Customer Sentiment | Deployment (DEAR) | Engagement (DEAR) | Depth of Adoption (DEAR) |
|---|---|---|---|---|---|---|---|
| ------------- | -- | ------------- | ------------------------------ | ------------------------- | ------------------- | ------------------- | ------------------------- |
| 1st Row Name | Name1 | Date1 | Green 78 ↑ | Orange 43 ↑ | Orange 40 | Red 0 ↓ | Green 100 ↑ |
| 2nd Row Name | Name2 | Date2 | Green 80 ↑ | Green 73 ↑ | Orange 40 | Green 100 ↑ | Green 80 ↑ |
| 3rd Row Name | Name3 | Date3 | Yellow 60 ↑ | Orange 63 ↑ | Orange 60 | Green 100 ↑ | Yellow 60 ↑ |
| 4th Row Name | Name4 | Date4 | Yellow 59 ↑ | Orange 37 ↑ | Orange 60 | Red 0 ↓ | Red 20 ↓ |
| 5th Row Name | Name5 | Date5 | Green 88 ↑ | Orange 57 ↑ | Orange 40 | Yellow 60 ↑ | Green 80 ↑ |
| 6th Row Name | Name6 | Date6 | Green 88 ↑ | Orange 63 ↑ | Orange 60 | Yellow 60 ↑ | Yellow 60 ↑ |
| 7th Row Name | Name7 | Date7 | Yellow 58 ↑ | Red 17 ↑ | Red 20 | Red 0 ↓ | Yellow 60 ↑ |
Thoughts and Additional Information
-
Health Tracking: This type of scoring system is crucial for customer retention strategies. By identifying potential risks early, proactive measures can be taken.
-
Visualization: The use of color-coding enhances the readability of the data, making it easy to identify high-risk accounts at a glance.
-
Customer Outcomes: Each metric contributes to the overall assessment of customer health and helps in understanding different aspects of customer interaction and satisfaction.
-
Improvement Areas: Accounts with lower scores in categories such as Engagement and Depth of Adoption might require more focused customer success initiatives to improve their health scores.
-
Proactive Interventions: Identifying low scores in sentiment and engagement early can allow for timely interventions and personalized engagement strategies, enhancing customer relationships and reducing churn.
By closely monitoring these metrics, a company can significantly improve customer satisfaction and retention rates, ultimately driving better business outcomes.
Reference:
Early Warning Sentiment
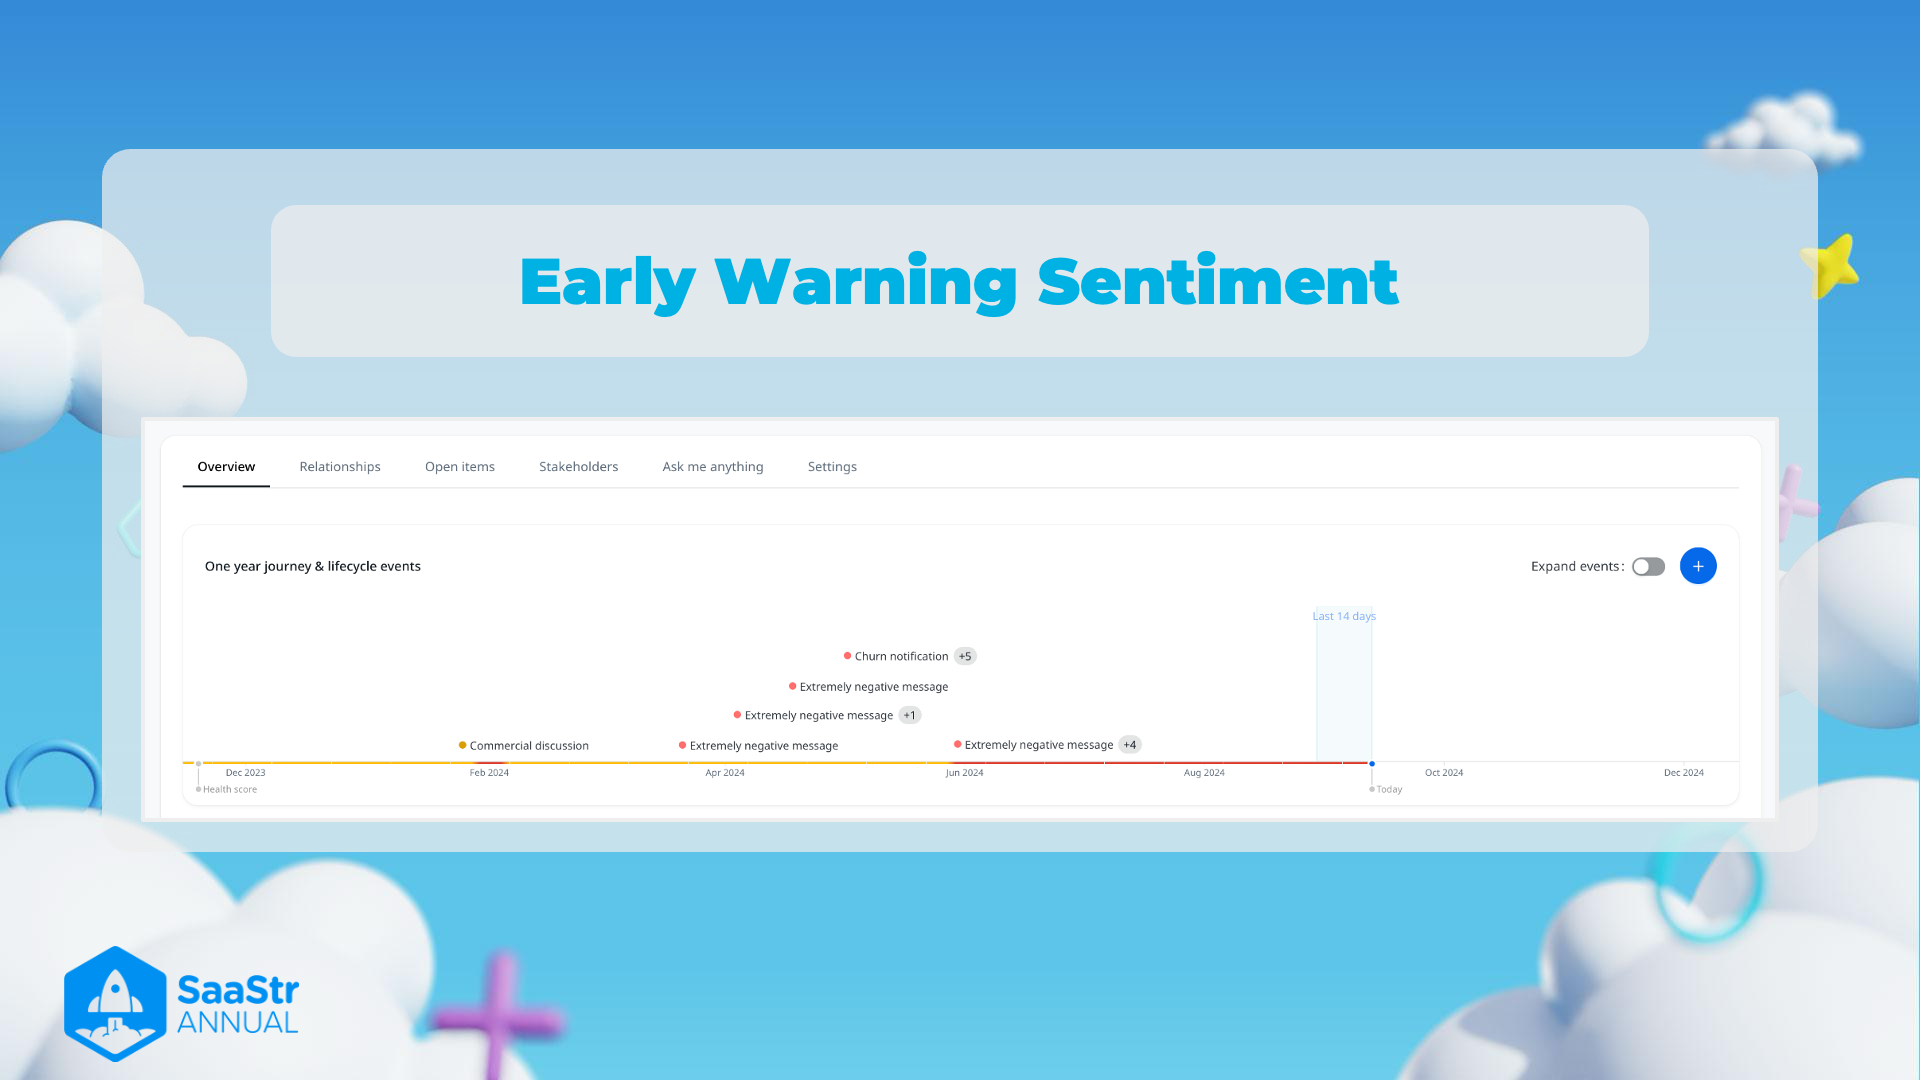
Overview of Image
The image shows a feature called "Early Warning Sentiment" designed to track events and sentiments over a one-year period. The layout indicates various sections and tabs, suggesting a dashboard interface.
Key Sections and Tabs
- Tabs:
- Overview: Default tab that provides a summary of key events and lifecycle.
- Relationships: Possibly tracks relationships related to the user or customer.
- Open items: Lists outstanding tasks or issues.
- Stakeholders: Keeps track of individuals or entities involved.
- Ask me anything: A general Q&A or help section.
- Settings: Configuration options and preferences.
Timeline Details
- Key Events:
- December 2023:
- Commercial discussion - Indicating a positive or neutral business interaction.
- February to August 2024:
- Series of extremely negative messages and a churn notification, with the latter having a count of
5.
- Series of extremely negative messages and a churn notification, with the latter having a count of
- December 2023:
Sentiment Indicators
- Extremely Negative Messages:
- Several points on the timeline (April, June, and August 2024) indicating dissatisfaction or issues.
- Specific messages have counts next to them, highlighting their significance (e.g.,
+1,+4).
- Churn Notification:
- Indicates customer churn (loss of customer) happening around June 2024, with a noted impact (
+5).
- Indicates customer churn (loss of customer) happening around June 2024, with a noted impact (
Additional Features
- Expand Events Toggle:
- Option to expand and view more events, potentially for a detailed view.
- Health Score:
- Likely a metric to track the overall status or health of the customer relationship, though specifics are not visible in the current view.
Context and Importance
- Purpose:
- The dashboard is designed to offer early warnings and track sentiment over time to prevent escalations and churn.
- Allows businesses to proactively address issues based on sentiment analysis.
- User Base:
- Useful for Customer Success Managers, Account Managers, and anyone involved in retaining customer relationships.
- Visual Design:
- Simplistic and clear, with key information easily accessible and highlighted for immediate attention.
Suggestions and Ideas
-
Proactive Measures:
- Based on negative messages, businesses can intervene early and deploy solutions, mitigating dissatisfaction.
-
Trend Analysis:
- Patterns in customer sentiment can be analyzed to improve product and service offerings.
-
Integration:
- Integration with CRM tools could automate data tracking and provide richer insights.
Conclusion
The Early Warning Sentiment dashboard is a powerful tool for tracking and responding to customer sentiment, providing actionable insights to maintain and improve customer relationships over time. It facilitates early identification of issues and ensures that corrective actions can be taken promptly.
Reference:
DAU-to-MAU Ratio vs. ACV
Overview
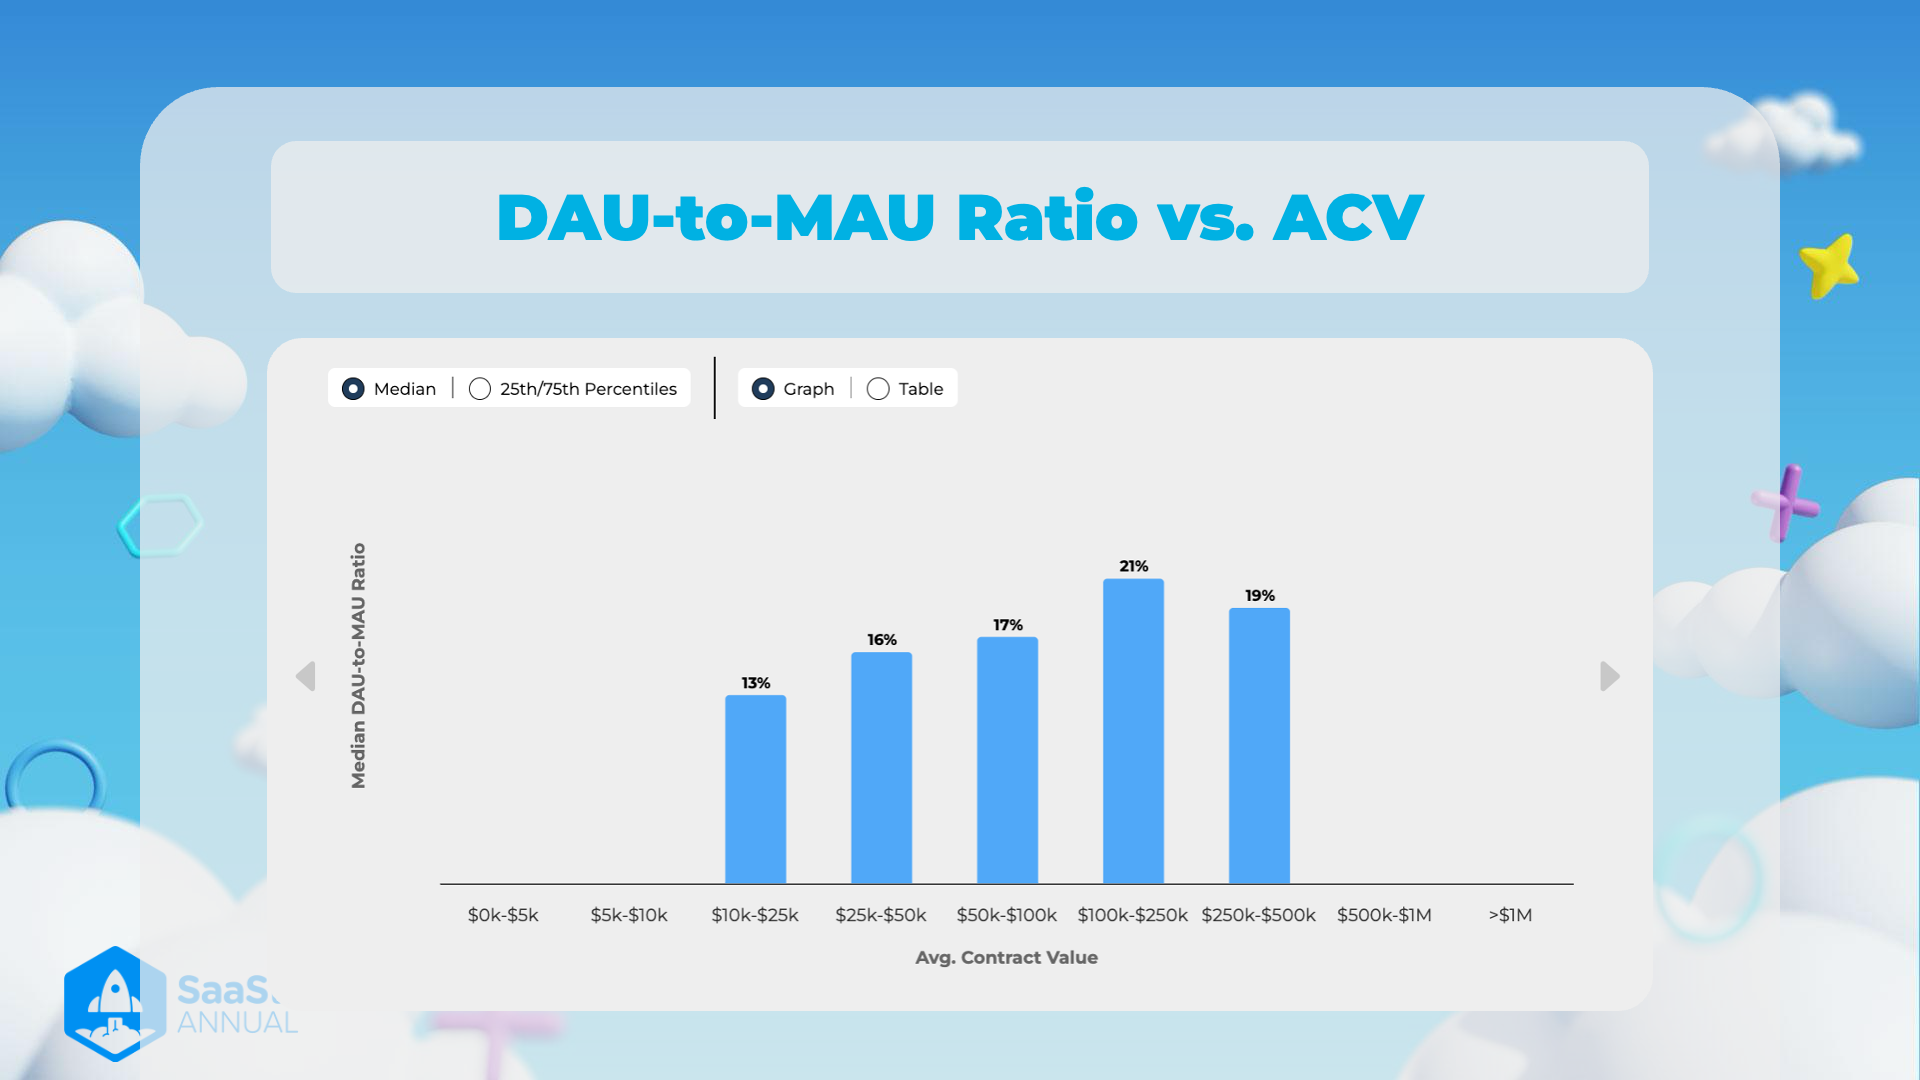
This graph displays the relationship between the Daily Active Users (DAU) to Monthly Active Users (MAU) ratio and the Average Contract Value (ACV) for various contract ranges in the SaaS (Software as a Service) industry. Key observations from this visual data can provide insights into user engagement relative to contract value.
Data Presentation
- Median DAU-to-MAU Ratio: The y-axis represents the median DAU-to-MAU ratio, indicating the percentage of users active daily compared to monthly active users.
- Average Contract Value: The x-axis categorizes different ranges of contract values, from "5k" to over "$1M".
Key Insights
- 5k: The median DAU-to-MAU ratio for this range is not explicitly displayed.
- 10k: Like the previous range, this specific data point is not provided.
- 25k: The ratio at this value is 13%.
- Insight: Lower contract values may correspond to lower daily engagement.
- 50k: The ratio increases to 16%.
- Insight: As contract value rises, the daily user engagement shows a slight increase.
- 100k: Further increase to 17%.
- Insight: A progressively increasing trend in engagement is visible.
- 250k: The peak ratio found here is 21%.
- Insight: Higher contract value tends to drive higher daily engagement.
- 500k: Slightly lower than the peak, with a ratio of 19%.
- Insight: Shows that very high value contracts still maintain high engagement.
- 1M and >$1M: Not explicitly displayed in this graph.
- Inference: Data might be available in an extended version or detailed table.
Observations and Thoughts
-
Trend Analysis:
- The data suggest a positive correlation between higher contract values and increased daily user engagement.
- There is a noticeable peak in user engagement around the 250k contract range.
-
Business Implications:
- SaaS providers might consider strategies to enhance user engagement by analyzing factors contributing to higher ratios in specific contract ranges.
- Understanding this correlation can aid in pricing strategies and customer relationship management.
-
Further Research:
- Additional detailed data, particularly for the omitted ranges, could provide a more comprehensive understanding.
- Comparative studies with additional variables, such as user satisfaction and feature usage, could enrich insights.
Graph Settings:
- Display Mode: Median values are shown.
- Data Presentation: The data is presented in graph format, with an option to view tables, likely for more detailed numerical comparison.
Conclusion
The graph effectively illustrates the relationship between DAU-to-MAU ratios and contract values, highlighting key patterns and offering strategic insights for SaaS businesses aiming to optimize user engagement relative to contract sizes.
Reference:
User Retention
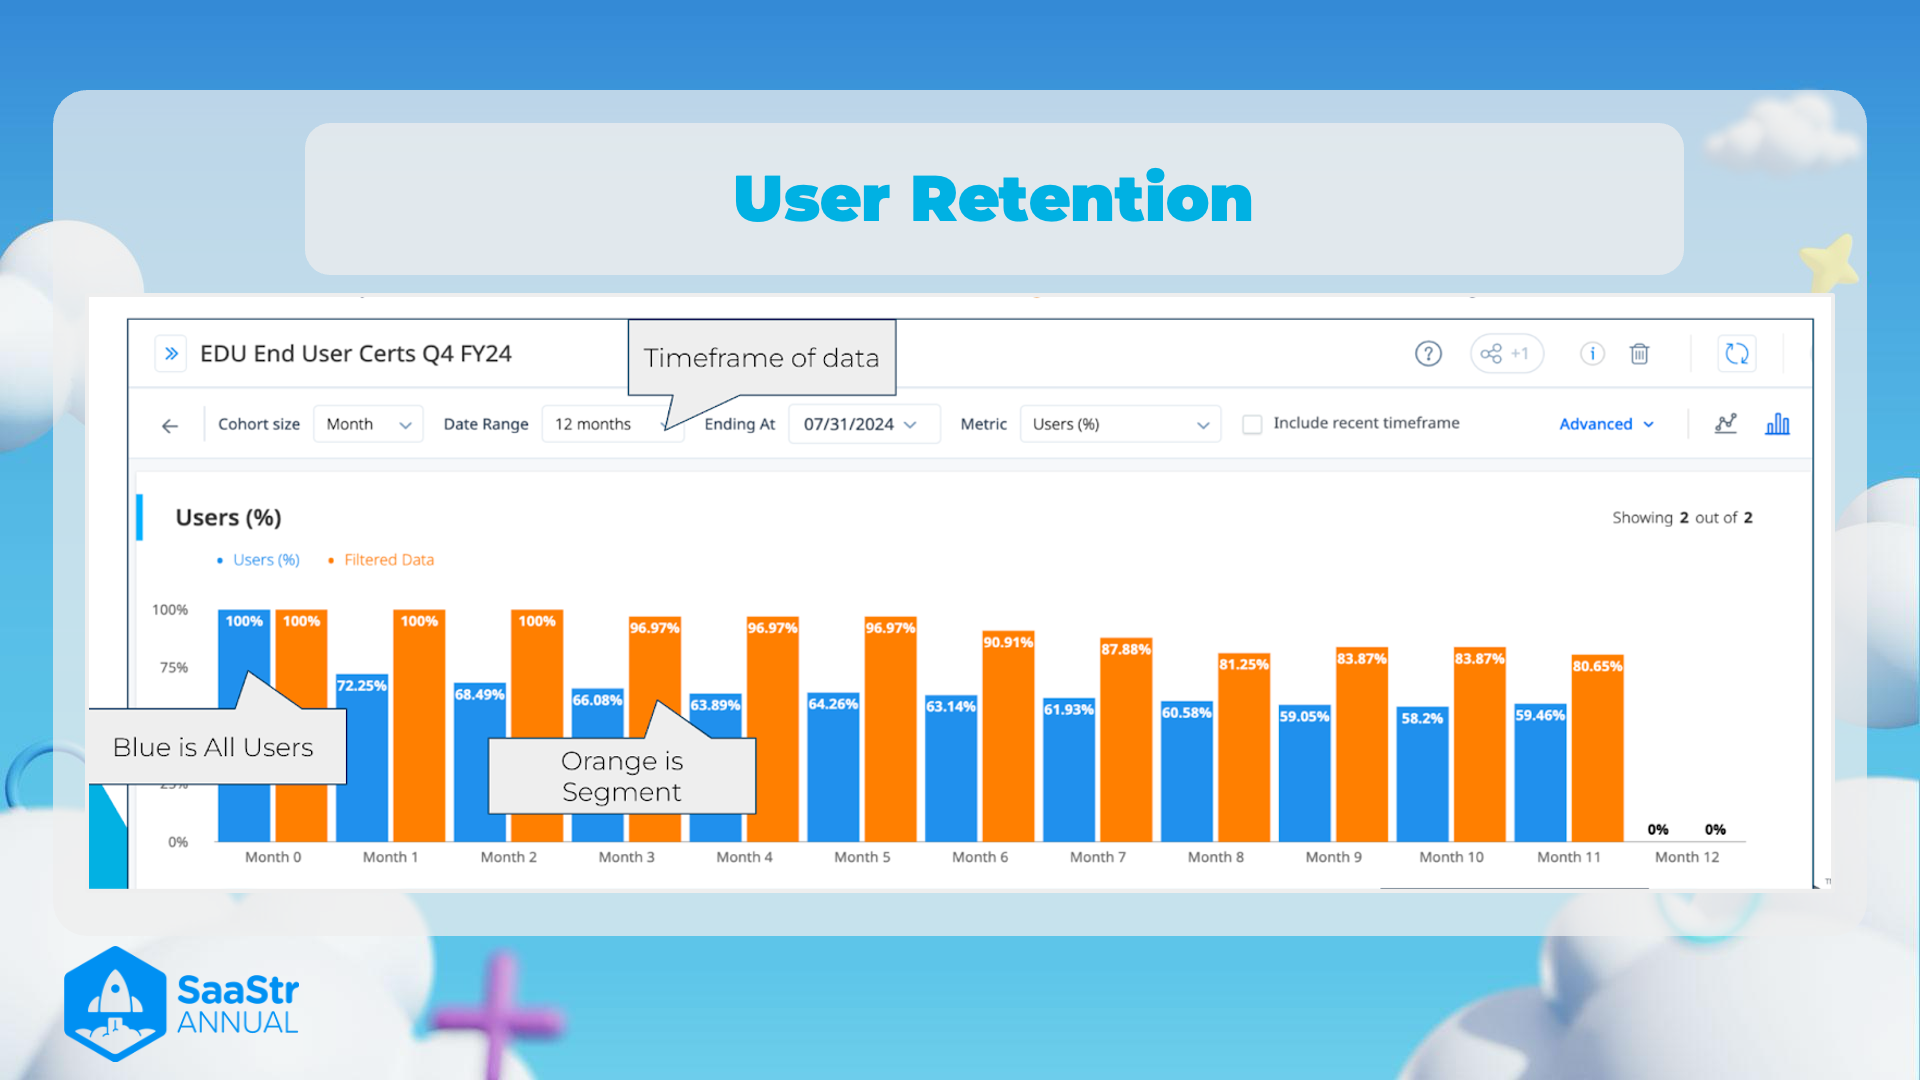
Notes and Thoughts
Title and General Context
- Title: User Retention
- This image focuses on user retention metrics specifically for EDU End User Certs in Q4 FY24.
- Retention metrics are vital for understanding user loyalty and product stickiness.
Timeframe of Data
- Date Range: 12 months, Ending at 07/31/2024
- The data covers a full year, ending mid-2024, which provides a comprehensive view of user retention over time.
- Monthly measurements are useful for observing trends and seasonal variations.
Segmentation
- Blue is All Users, Orange is Segment
- Two groups are being compared: a general user group (blue) and a specific segment (orange).
- It's essential to analyze different segments to tailor strategies for various user groups.
User Retention Trends
- Month-by-Month Analysis:
- Month 0: 100% retention for both groups.
- Month 1: Sharp drop to 72.25% (Segment) and 68.49% (All Users).
- Month 2: Decline continues, with rates at 68.49% (Segment) and 66.08% (All Users).
- Month 3: Slight increase to 96.97% (Segment), while All Users drops to 63.89%.
- Month 4: 96.97% (Segment) and decrease to 64.26% (All Users).
- Month 5: Plateau for Segment at 96.97%, but All Users drop to 63.14%.
- Month 6: Notable drop to 90.91% (Segment) and 61.93% (All Users).
- Month 7-8: Continued decline for both groups, touching 80.87% (Segment) and 60.58% (All Users) by Month 8.
- Month 9-12: Significant drop for All Users, ending at 58.2%, whereas the Segment consistently shows about 83.87% till Month 11, drops to 59.46% by Month 12.
Additional Information
- User retention is crucial for SaaS companies to measure as it affects long-term revenue and customer lifetime value.
- Understanding where the steepest drop-offs occur can help in creating targeted user engagement and retention strategies.
- Tracking segmented groups helps in recognizing which user profiles remain loyal and adjusting services or products to retain others.
Table of User Retention (%):
| Month | All Users (%) | Segment (%) |
|---|---|---|
| Month 0 | 100% | 100% |
| Month 1 | 68.49% | 72.25% |
| Month 2 | 66.08% | 68.49% |
| Month 3 | 63.89% | 96.97% |
| Month 4 | 64.26% | 96.97% |
| Month 5 | 63.14% | 96.97% |
| Month 6 | 61.93% | 90.91% |
| Month 7 | 60.58% | 87.88% |
| Month 8 | 59.05% | 81.25% |
| Month 9 | 58.2% | 83.87% |
| Month 10 | 59.46% | 83.87% |
| Month 11 | 0% | 80.65% |
| Month 12 | 0% | 0% |
Key Notes for Future Actions:
- Investigate the cause of significant drop-offs, especially noticeable between Months 1 and 2.
- Evaluate the driving factors behind high retention rates in the Segment from Months 0 to 6.
- Consider developing targeted re-engagement campaigns for user groups showing lower retention rates.
Reference:
JO Adoption Dashboard Overview
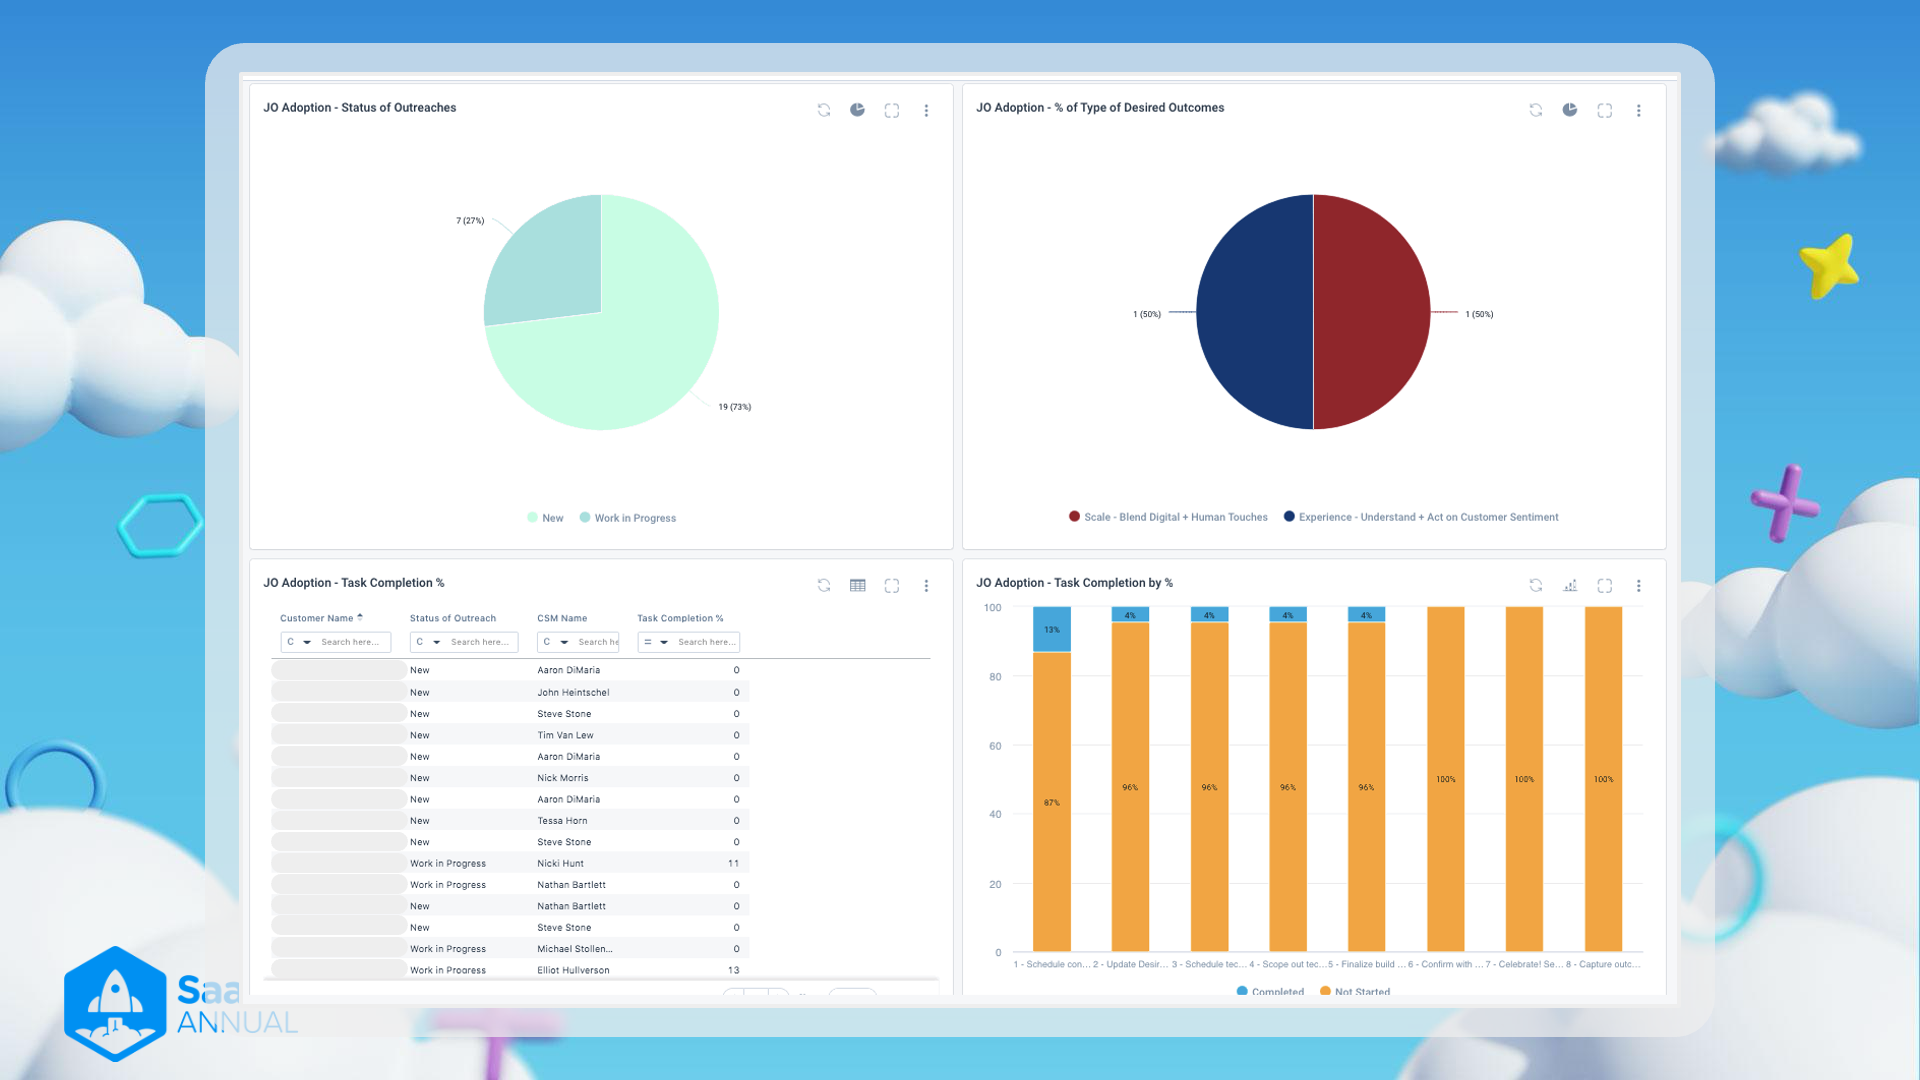
1. JO Adoption - Status of Outreaches
- Visualization: Pie Chart
- Data:
- New: 19 (73%)
- Work in Progress: 7 (27%)
- Insight: The majority of outreach statuses are new, with only a small percentage being classified as "Work in Progress". This indicates that most tasks are at the initial stage.
2. JO Adoption - % of Type of Desired Outcomes
- Visualization: Pie Chart
- Data:
- Scale - Blend Digital + Human Touches: 50% (1)
- Experience - Understand + Act on Customer Sentiment: 50% (1)
- Insight: The desired outcomes are evenly split between scaling through a blend of digital and human touches and focusing on customer sentiment and response. This suggests a balanced approach towards automation and personalized interaction.
3. JO Adoption - Task Completion %
-
Visualization: Table
-
Data:
Customer Name Status of Outreach CSM Name Task Completion % New New Aaron DiMaria 0 New New John Heintshel 0 New New Steve Stone 0 New New Tim Van Lew 0 New New Aaron DiMaria 0 New New Nick Morris 0 New New Aaron DiMaria 0 New New Tessa Horn 0 New New Steve Stone 0 Work in Progress Work in Progress Nick Hunt 11 Work in Progress Work in Progress Nathan Bartlett 0 Work in Progress Work in Progress Steve Stone 11 New New Nathan Bartlett 0 New New Michael Stolten 0 Work in Progress Work in Progress Elliot Hullerson 13 -
Insight: Most customers are marked as 'New' with 0% task completion, indicating early stages of adoption. Few 'Work in Progress' customers show some completion percentages, indicating ongoing work on tasks.
4. JO Adoption - Task Completion by %
- Visualization: Bar Chart
- Data:
- Bar Segments: 8 steps with respective completion levels
- Overall Completion: High percentage of tasks are completed (87% - 100%) with only small segments not started (4% to 13%)
- Insight: The tasks show a high completion rate overall, with a minimum of 87% tasks completed for any given step. There are few tasks that have not started, indicating efficient task management and execution.
Notes on Progress:
- The analysis shows promising engagement levels with the majority of the tasks either underway or in the early stages.
- The dual focus on automated scaling and personal customer sentiment responses could suggest a strategy to balance efficiency with customer satisfaction.
- Those involved in outreach and task management can use this data to prioritize starting new tasks and bringing 'Work in Progress' tasks to completion.
Reference:
SaaStr Annual CS Team Lifecycle Process
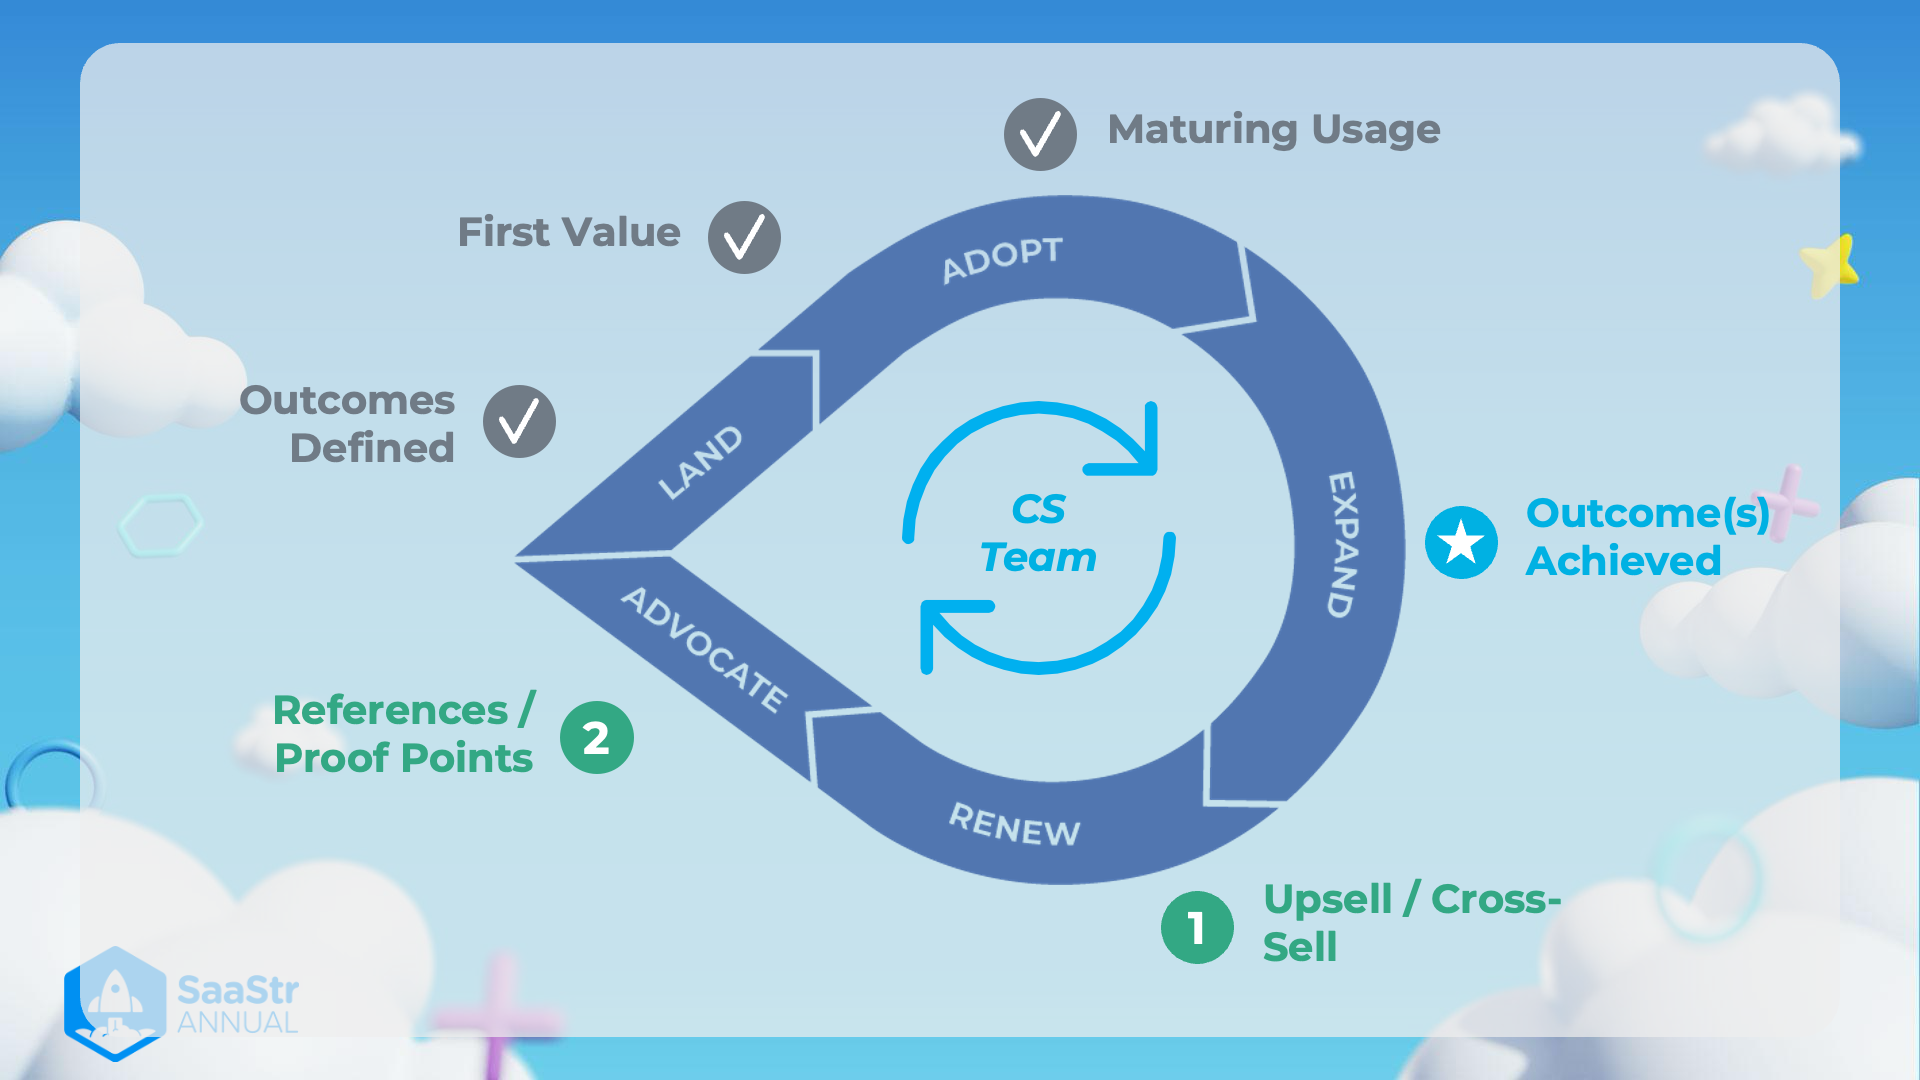
Overall Process
The image illustrates a cyclical process managed by the Customer Success (CS) team to achieve and sustain business outcomes. Each stage in this process is essential for fostering customer growth and retention.
Stages of the Process
-
Land
- Explanation: The initial phase where new customers are acquired.
- Additional Information: This involves onboarding, setting up the product/service, and ensuring the customer can start using it.
-
Adopt
-
Explanation: Customers begin to use the product and integrate it into their processes.
-
Additional Information: The focus is on ensuring customers derive initial value and see benefits early on.
-
Key Milestone:
- First Value Achieved: At this point, customers start experiencing the core benefits of the product.
-
-
Expand
-
Explanation: Customers leverage more features, increase usage, and potentially purchase additional products/services.
-
Additional Information: The aim is to grow the account by demonstrating value that leads to upselling or cross-selling.
-
Key Milestone:
- Maturing Usage: Indicates increasing customer engagement and deeper product utilization.
-
-
Renew
-
Explanation: The phase where the CS team ensures that customers are likely to renew their subscriptions/contracts.
-
Additional Information: This involves regular check-ins, performance reviews, and addressing any issues that might hinder renewal.
-
Key Milestone:
- Outcome(s) Achieved: Success metrics are met, leading customers to see the promised value.
-
-
Advocate
-
Explanation: Satisfied customers become advocates for the product/service.
-
Additional Information: Advocacy can lead to referrals, testimonials, and case studies that support sales and marketing efforts.
-
Key Milestone:
- References/Proof Points: Collection of customer success stories and references that can be used to attract new business.
-
Important Focus Points for the CS Team
-
Outcomes Defined
- Explanation: Outcomes for success are defined early in the process.
- Additional Information: Clarifying expected results ensures both the CS team and customers have aligned goals.
-
Ongoing Monitoring
- Explanation: Continuous engagement with the customer to monitor usage and satisfaction.
- Additional Information: Regular feedback loops help to adapt and improve the customer success strategy.
General Notes
- Upsell/Cross-Sell Opportunities: Identified in the Expand phase to grow account value.
- CS Team Role: They play a pivotal role throughout this lifecycle, focusing on customer satisfaction and continuous engagement.
The image effectively simplifies the complex process of customer management into a clear, visualized cycle, emphasizing the importance of each phase for achieving long-term success.
Reference:
Pre-Defined Metrics Aligned to Outcomes
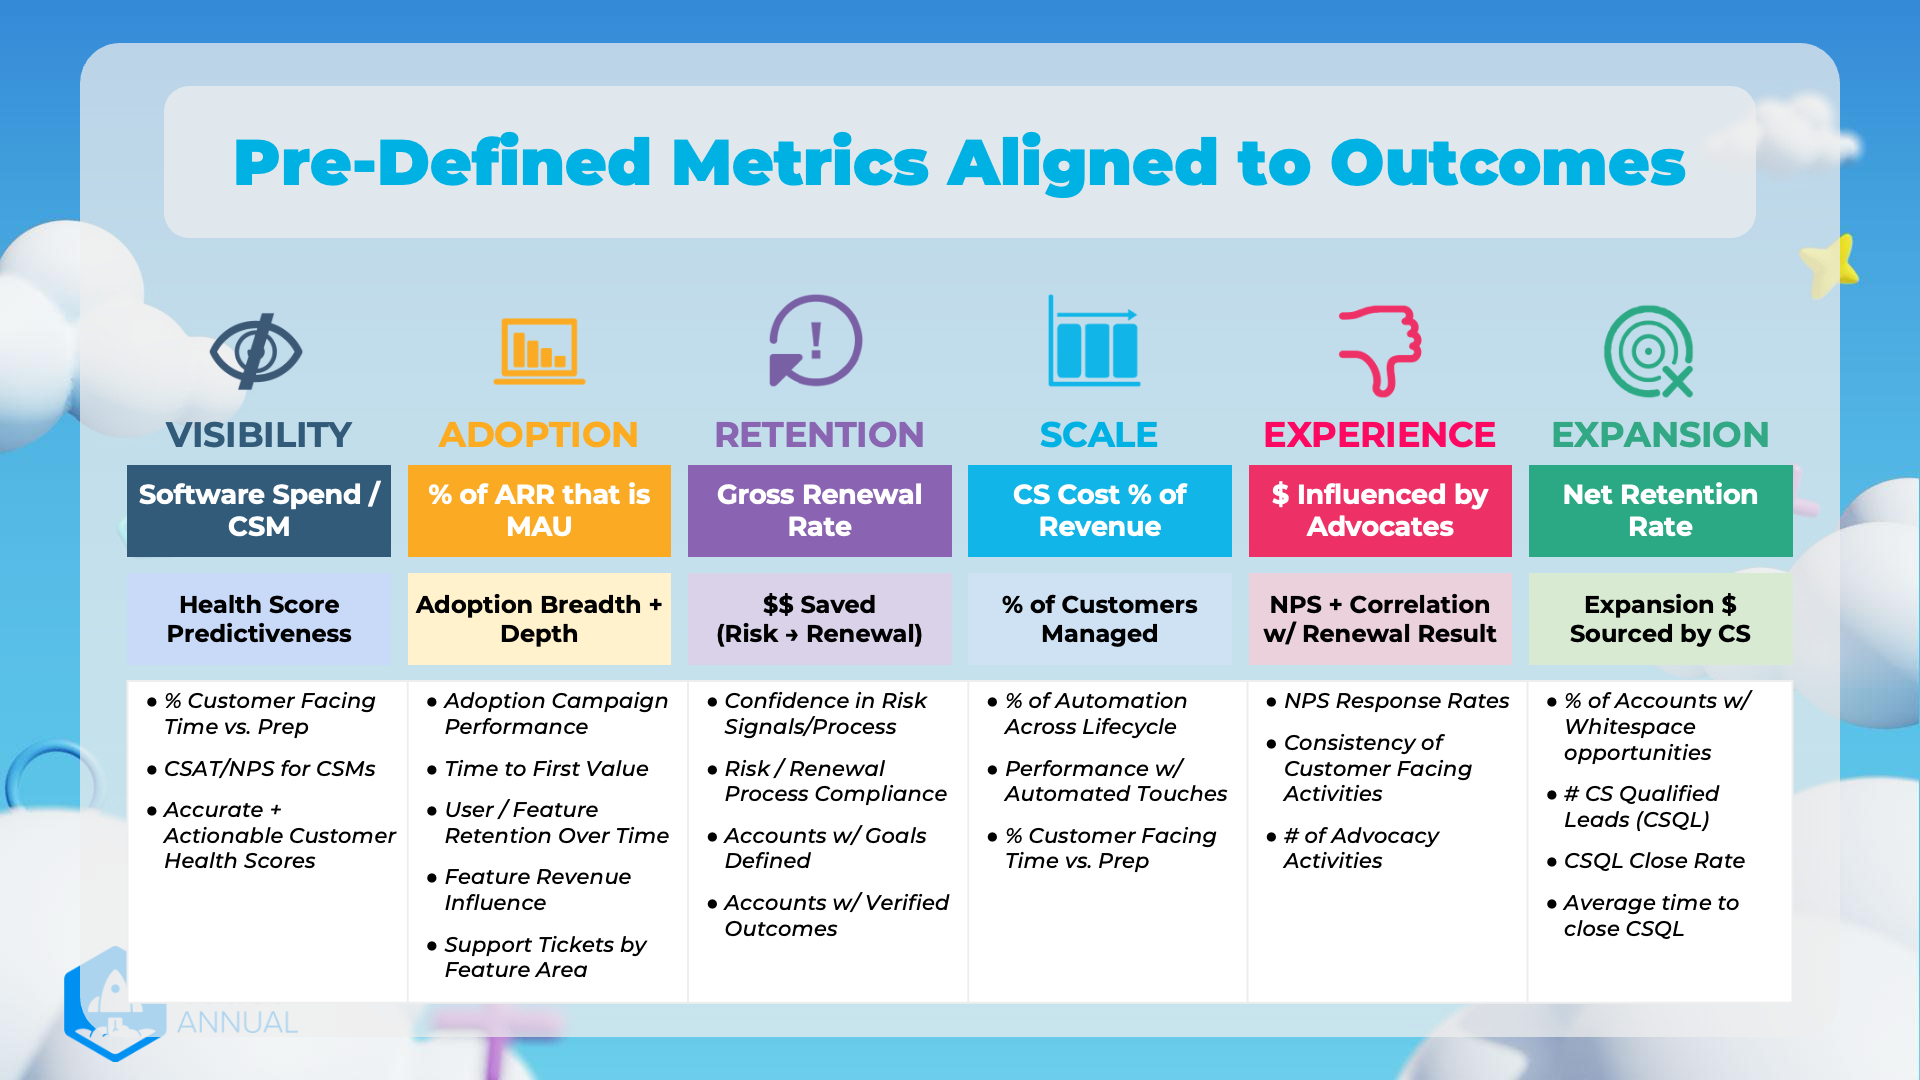
Categories and Metrics
VISIBILITY
Metrics:
- Software Spend / CSM
- Health Score Predictiveness
- % Customer Facing Time vs. Prep
- CSAT/NPS for CSMs
- Accurate + Actionable Customer Health Scores
Thoughts:
- Understanding software spend helps budget efficiently.
- Predictive health scores can proactively identify at-risk customers.
ADOPTION
Metrics:
- % of ARR that is MAU
- Adoption Breadth + Depth
- Adoption Campaign Performance
- Time to First Value
- User / Feature Retention Over Time
- Feature Revenue Influence
- Support Tickets by Feature Area
Thoughts:
- Tracking annual recurring revenue (ARR) as a monthly active user (MAU) ensures customer engagement.
- Adoption campaigns must be measurable to assess their effectiveness.
RETENTION
Metrics:
- Gross Renewal Rate
- $$ Saved (Risk → Renewal)
- Confidence in Risk Signals/Process
- Risk / Renewal Process Compliance
- Accounts w/ Goals Defined
- Accounts w/ Verified Outcomes
Thoughts:
- Renewal rates directly impact revenue sustainability.
- Saving at-risk accounts converts potential losses into gains.
SCALE
Metrics:
- CS Cost % of Revenue
- % of Customers Managed
- % of Automation Across Lifecycle
- Performance w/ Automated Touches
- % Customer Facing Time vs. Prep
Thoughts:
- Scaling customer service efficiently balances costs.
- Automation reduces manual workload, allowing for focus on strategic activities.
EXPERIENCE
Metrics:
- $ Influenced by Advocates
- NPS + Correlation w/ Renewal Result
- NPS Response Rates
- Consistency of Customer Facing Activities
-
of Advocacy Activities
Thoughts:
- Net Promoter Score (NPS) indicates customer satisfaction and loyalty.
- Advocacy efforts can have a monetary impact, influencing renewals and upsells.
EXPANSION
Metrics:
- Net Retention Rate
- Expansion $ Sourced by CS
- % of Accounts w/ Whitespace opportunities
-
CS Qualified Leads (CSQL)
- CSQL Close Rate
- Average time to close CSQL
Thoughts:
- Retention coupled with expansion indicates overall growth.
- Identifying and closing new opportunities enhances revenue streams.
Summary Table
| Category | Key Metric | Supporting Metrics / Notes |
|---|---|---|
| VISIBILITY | Software Spend / CSM | - % Customer Facing Time vs. Prep - CSAT/NPS for CSMs - Accurate + Actionable Customer Health Scores |
| ADOPTION | % of ARR that is MAU | - Adoption Campaign Performance - Time to First Value - User / Feature Retention Over Time - Feature Revenue Influence - Support Tickets by Feature Area |
| RETENTION | Gross Renewal Rate | - Confidence in Risk Signals/Process - Risk / Renewal Process Compliance - Accounts w/ Goals Defined - Accounts w/ Verified Outcomes |
| SCALE | CS Cost % of Revenue | - % of Automation Across Lifecycle - Performance w/ Automated Touches - % Customer Facing Time vs. Prep |
| EXPERIENCE | $ Influenced by Advocates | - NPS Response Rates - Consistency of Customer Facing Activities - # of Advocacy Activities |
| EXPANSION | Net Retention Rate | - % of Accounts w/ Whitespace opportunities - # CS Qualified Leads (CSQL) - CSQL Close Rate - Average time to close CSQL |
These metrics are aligned to specific outcomes helping businesses measure and improve upon various parameters. They contribute to the bigger picture by offering insights and actionable data points crucial for achieving key business goals.
Reference:
Success Plan Process
Overview
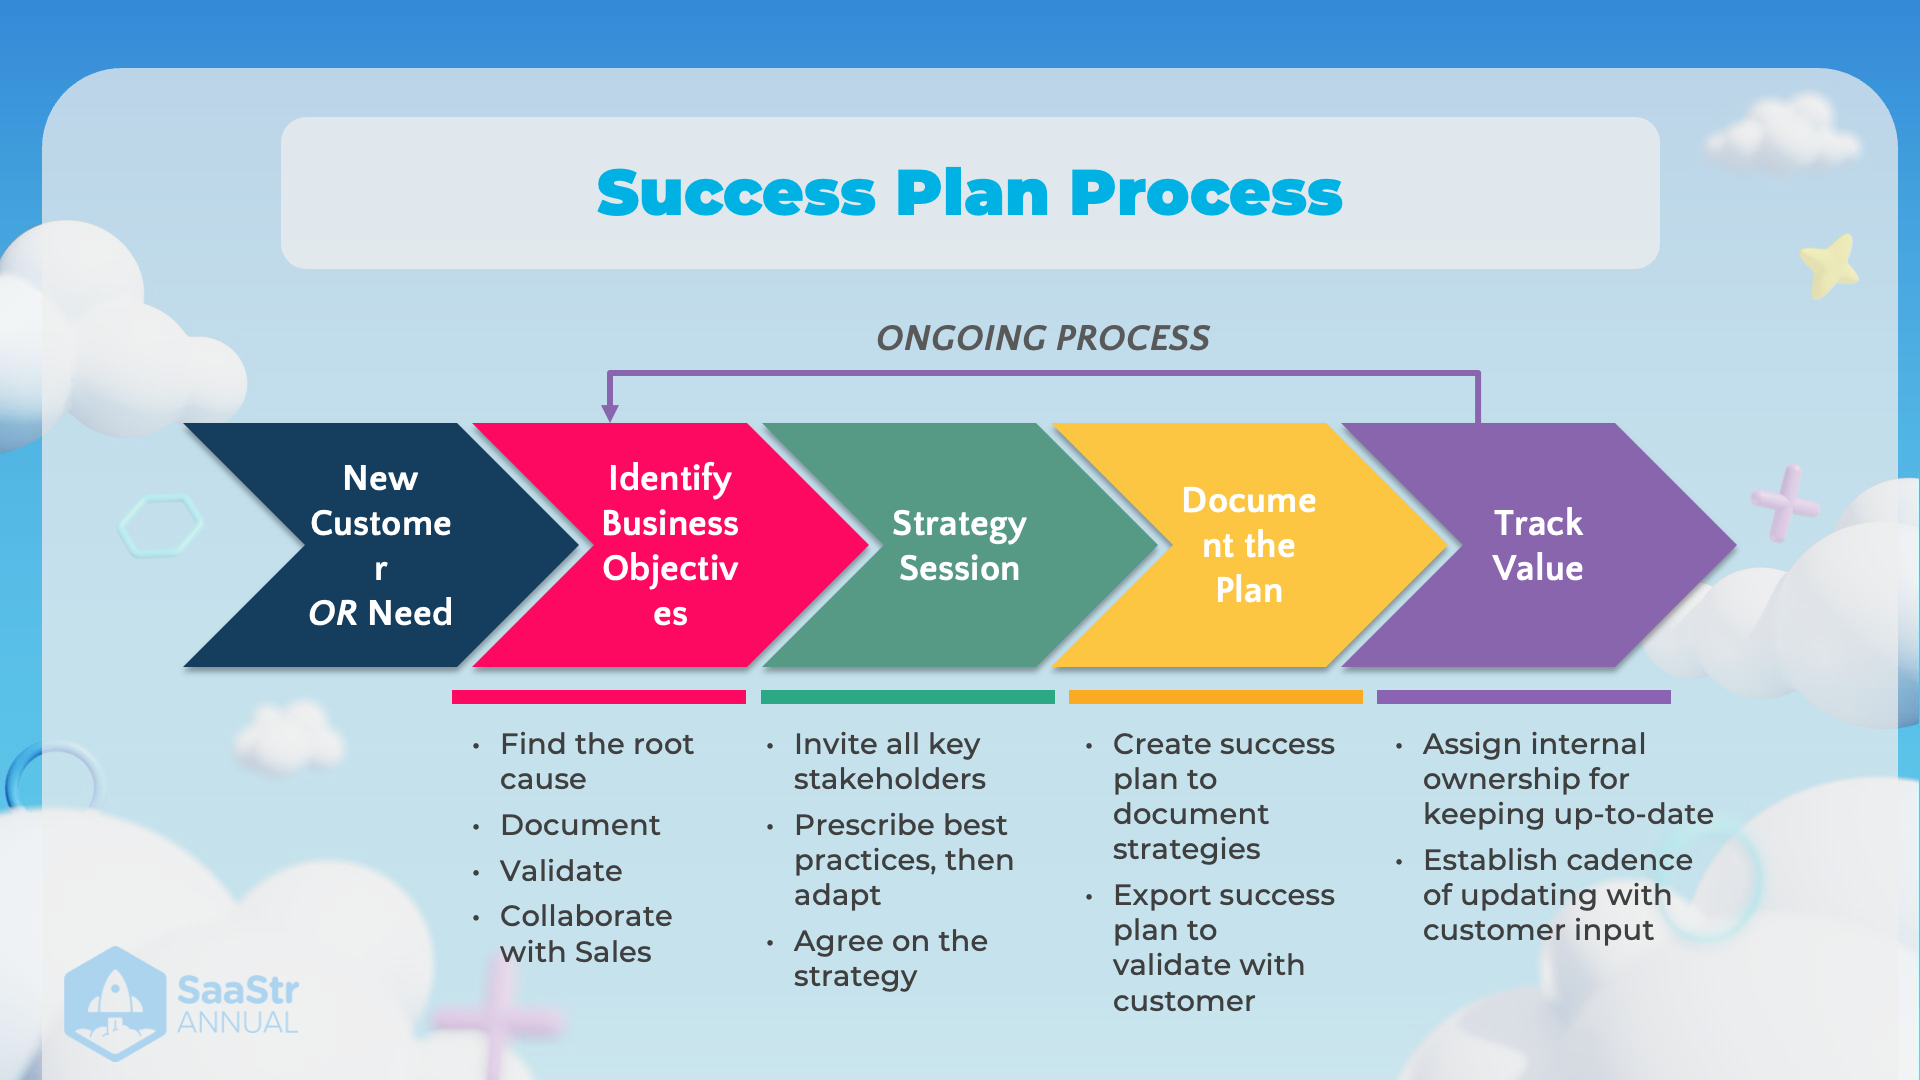
The image details a structured process for planning and ensuring the success of business initiatives and customer needs within an ongoing process. This is essential for sustained growth and alignment of business objectives with customer satisfaction.
New Customer or Need
- Find the root cause:
- Understand the underlying issues or needs of a new customer or existing need.
- Identifying the root cause helps in framing the correct business questions and directing efforts appropriately.
- Document:
- Keep a record of findings and observations to refer back to and track progress.
- Documentation is critical for maintaining a clear viewpoint and developing accurate solutions.
- Validate:
- Confirm that the identified needs or issues are accurate and relevant.
- This ensures that time and resources are being directed towards solving the right problem.
- Collaborate with Sales:
- Engage with the sales team to verify alignment on identified needs.
- Sales insights often provide valuable context and additional customer perspectives.
Identify Business Objectives
- Invite all key stakeholders:
- Bring together everyone involved in or impacted by the business strategy.
- Encourages buy-in and ensures diverse perspectives are considered.
- Prescribe best practices, then adapt:
- Recommend standard procedures and proven strategies first.
- Be flexible to adapt these practices to the specific context and needs of the business.
- Agree on the strategy:
- Ensure that all stakeholders are on the same page with the chosen strategy.
- This alignment prevents misunderstandings and sets clear expectations.
Strategy Session
- This phase involves collaborative meetings to plan and refine the strategy with stakeholders. It ensures everyone understands the objectives and their roles.
Document the Plan
- Create success plan to document strategies:
- Develop a comprehensive plan detailing the strategies and approaches to meet business objectives.
- A well-documented plan provides direction and a reference point for all involved.
- Export success plan to validate with customer:
- Share the documented plan with the customer for their input and validation.
- This step ensures that the customer’s perspective is accounted for and helps achieve customer satisfaction.
Track Value
- Assign internal ownership for keeping up-to-date:
- Designate specific individuals responsible for maintaining the plan's relevancy.
- Ownership ensures accountability and continuous oversight.
- Establish cadence of updating with customer input:
- Regularly review and update the plan based on feedback and changing circumstances.
- Frequent updates and customer input ensure the plan remains aligned with evolving needs and objectives.
Ongoing Process
- The cycle from identifying needs to tracking the value is continuous. Regular evaluations and iterations are necessary to stay responsive and relevant.
This structured approach provides a clear and systematic framework ensuring that business strategies align with customer needs, which is crucial for sustained success and growth.
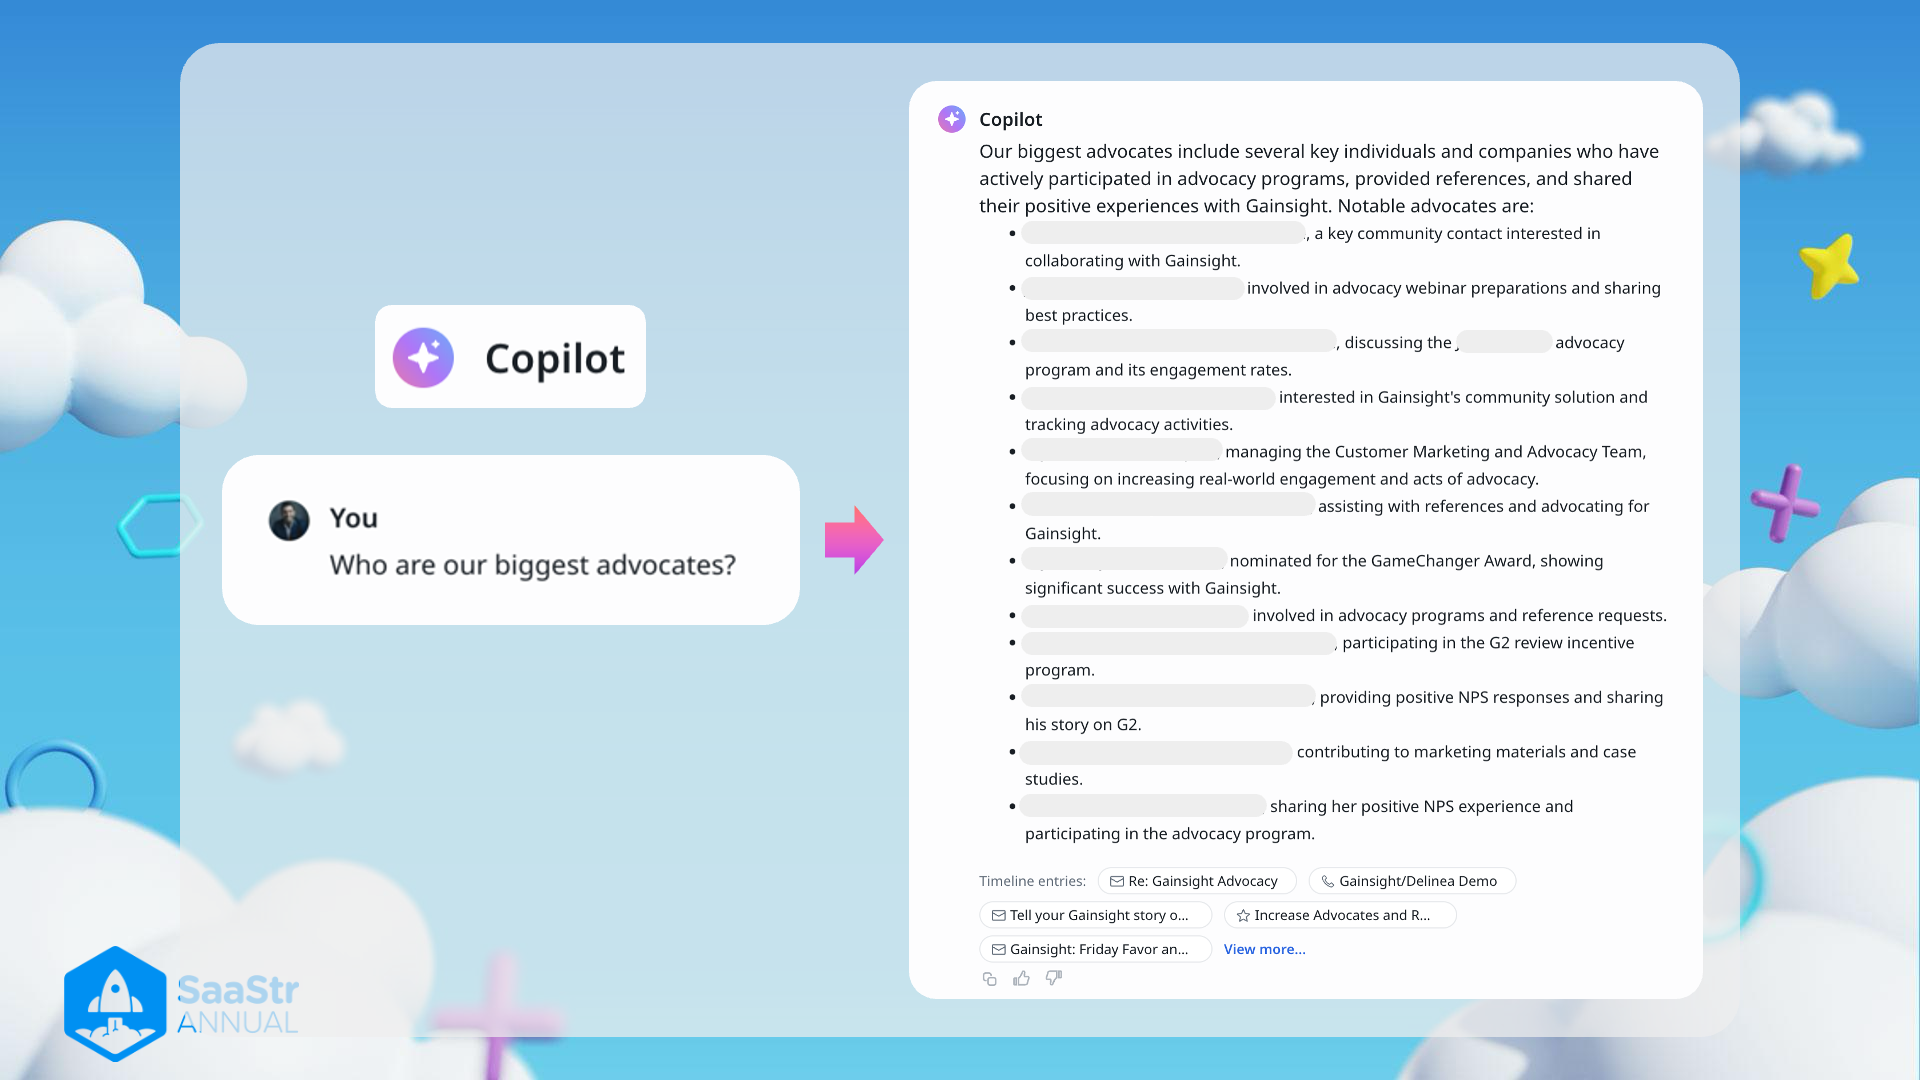
Copilot: Gainsight Advocacy Information
Key Points and Context
Identification of Advocates
- Collaboration Focus: Key community contacts are interested in collaborating with Gainsight.
- It might be helpful to create specific collaboration platforms or channels for these individuals to enhance their engagement.
Advocacy Involvements
- Advocacy Webinar Preparations: Individuals involved in preparing for advocacy webinars and sharing best practices.
- This indicates a high level of engagement and willingness to teach others, which can be leveraged to create more educational content.
Program Engagement
- Advocacy Program and Engagement Rates: Discussions on advocacy program engagement rates.
- Gathering this information can be useful for analyzing the effectiveness of advocacy programs and making data-driven improvements.
Community Solutions
- Interest in Gainsight's Community Solution: Tracking advocacy activities.
- Utilizing community solutions to organize and monitor advocacy activities can streamline efforts and improve efficiency.
Customer Marketing and Advocacy Team Management
- Focusing on Real-world Engagement: Managing teams to increase engagement and acts of advocacy.
- Effective team management is crucial for maintaining a high level of advocacy and ensuring that efforts translate into real-world results.
Providing References and Advocating
- Assisting with References: Advocates helping with providing references for Gainsight.
- This can be highly valuable for potential new customers looking for testimonials and success stories.
Awards and Recognition
- GameChanger Award Nominee: Significant success with Gainsight recognized by nominations for awards.
- Recognizing advocates through awards can motivate others and highlight the successes of using Gainsight.
Participation in Programs
- Advocacy Programs and Incentive Programs: Individuals involved in reference requests and G2 review incentive programs.
- These programs can encourage more active participation and contribution from advocates.
Positive Feedback and Case Studies
- Providing NPS Responses: Contributors sharing their positive experiences and success stories.
- Net Promoter Scores (NPS) can provide valuable feedback on user satisfaction and areas of improvement.
- Marketing Material Contribution: Inclusion in marketing materials and case studies.
- Having advocates contribute to marketing materials can add authenticity and credibility to the content.
Enhanced Contribution Channels
- Sharing Experiences and Advocacy Participation: Advocates sharing their experiences and actively participating in advocacy programs.
- Continuous sharing and involvement can keep the advocacy community vibrant and engaged.
Additional Notes
- Timeline Entries: Lists of specific entries related to advocacy activities such as "Re: Gainsight Advocacy," "Tell your Gainsight story," and "Increase Advocates." This could indicate a structured timeline of advocacy activities being tracked.
- These entries might represent ongoing initiatives or communication threads that can be referenced for past advocacy efforts and planning future endeavors.
Reference:
"REAL" ADVOCATES
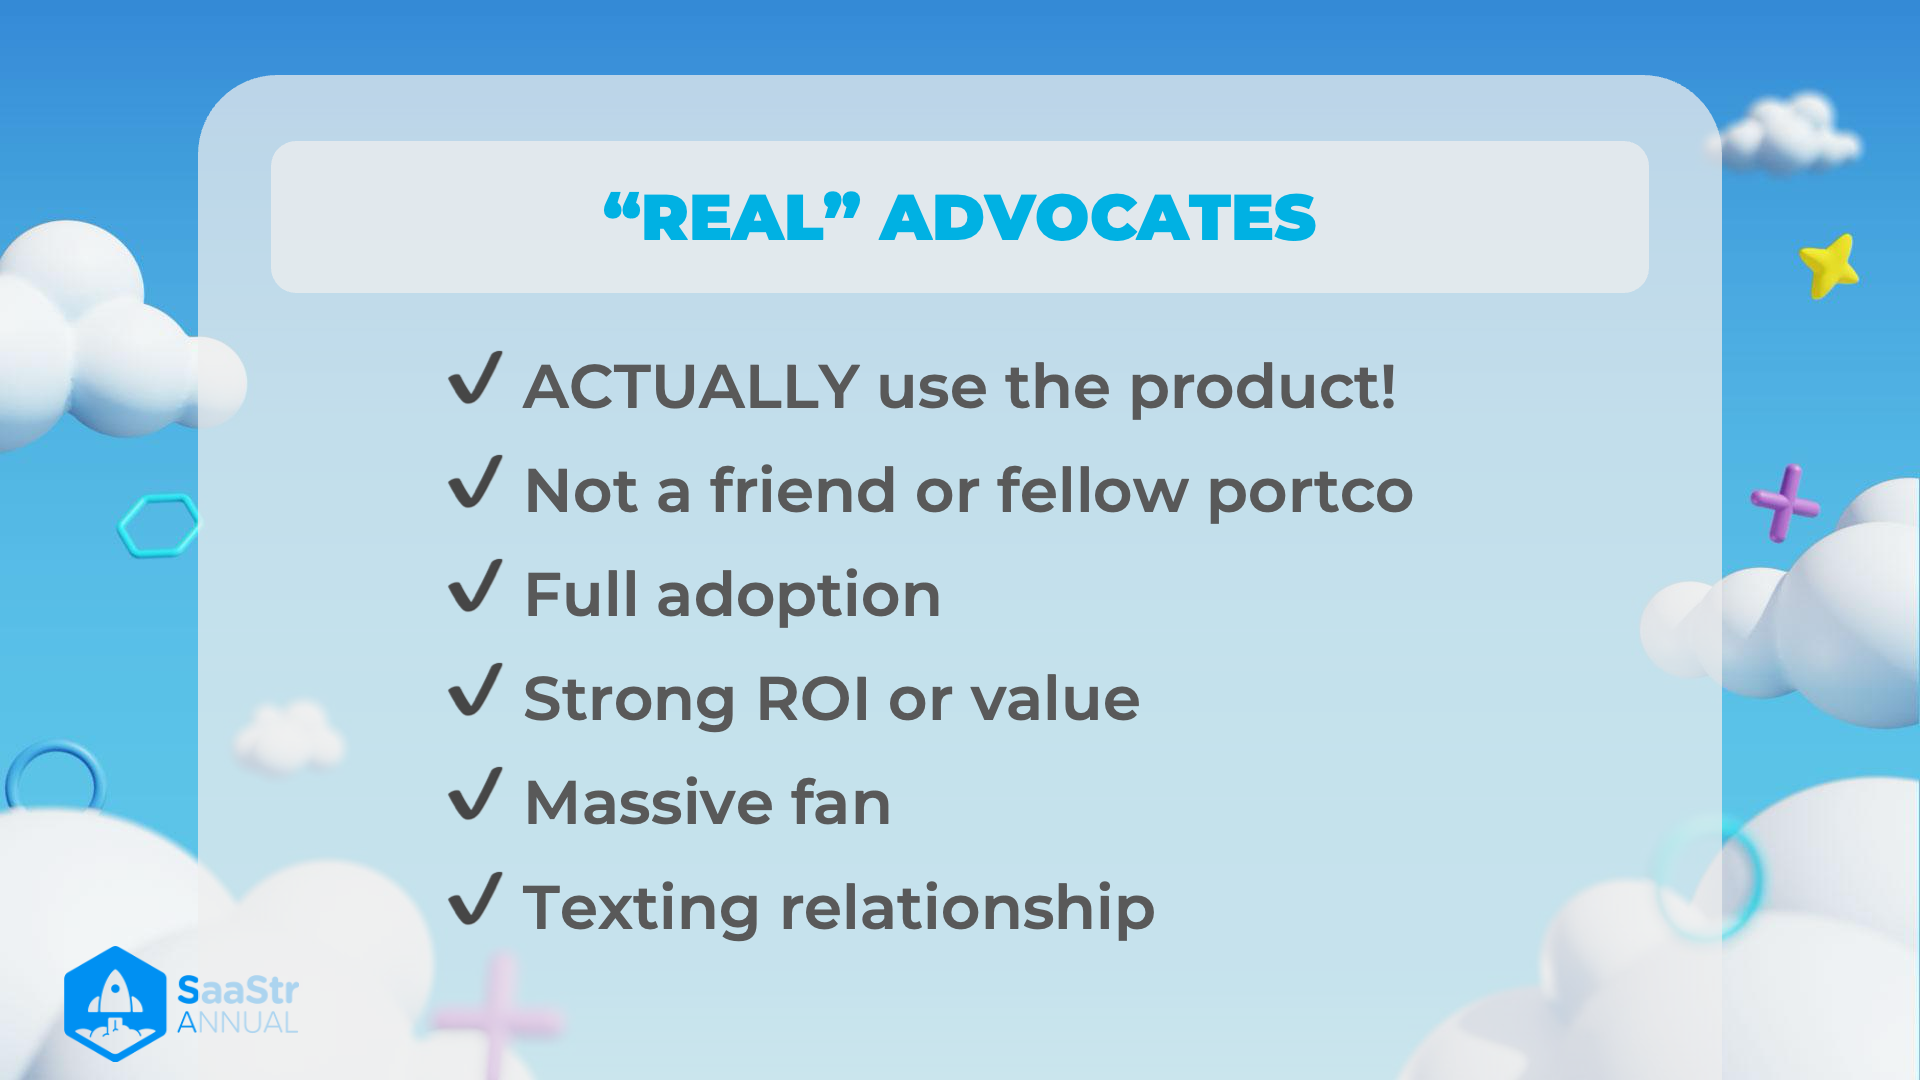
- ACTUALLY use the product!
- Real advocates are active users of the product, ensuring authentic feedback and reliable testimonials.
- Not a friend or fellow portco
- Genuine advocates are independent users with no personal or professional affiliation, ensuring unbiased opinions.
- Full adoption
- Full integration and consistent use of the product demonstrate deep trust and dependency, providing stronger case studies.
- Strong ROI or value
- Seeing a significant return on investment or value solidifies the advocate’s support, making their endorsement more impactful.
- Massive fan
- Passionate users who actively promote the product out of sheer enthusiasm can drive organic growth through word-of-mouth.
- Texting relationship
- Close relationships between product providers and users allow for real-time feedback and a strong, personal connection, enhancing credibility.
Reference:
CS Spend % of ARR vs ARR
Notes
-
Title and Context
- The title of the image is: CS Spend % of ARR vs ARR
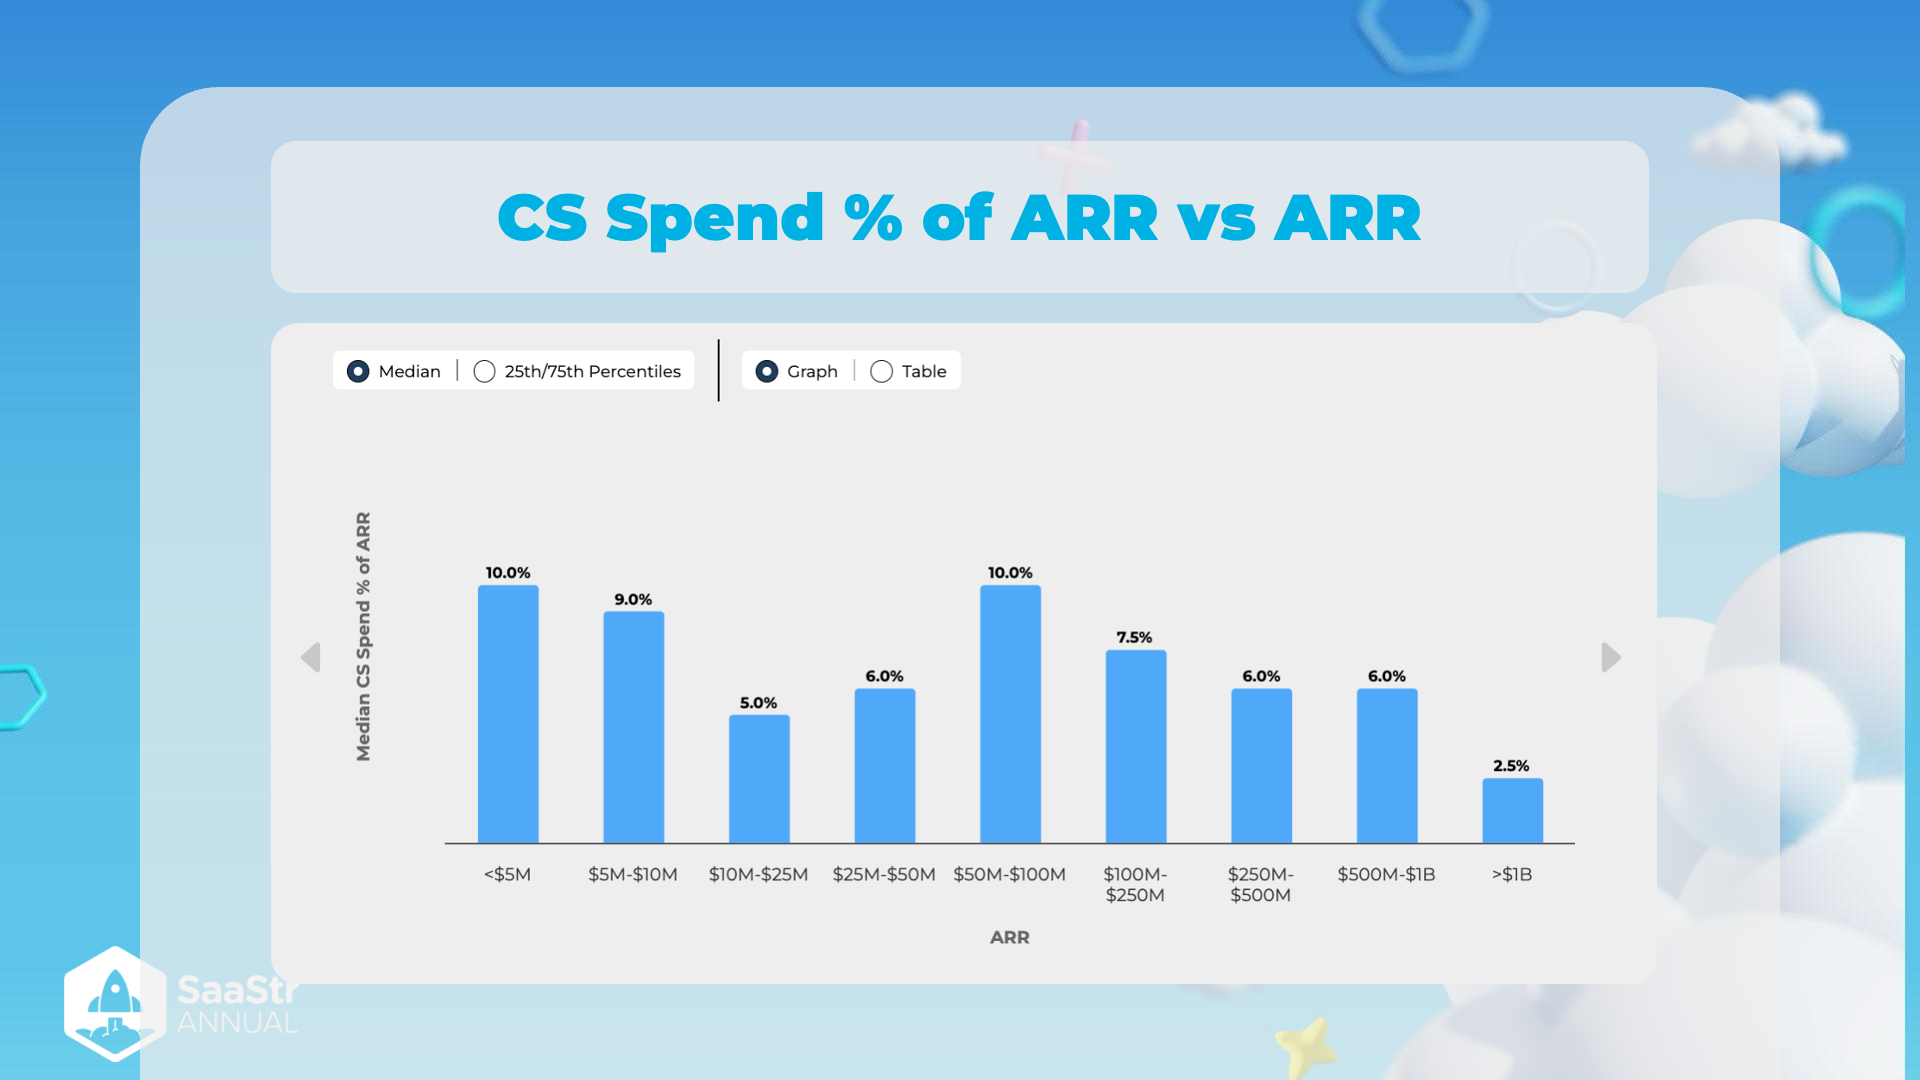
- Context: The image shows a bar graph comparing Customer Success (CS) spending as a percentage of Annual Recurring Revenue (ARR) across different ARR ranges. This is useful for understanding how companies of various sizes allocate their resources towards customer success.
-
Graph Overview
- The graph is categorized by Annual Recurring Revenue (ARR) ranges on the x-axis.
- The y-axis represents the Median CS Spend % of ARR.
- The blue bars indicate these percentages for different ARR ranges, indicating how much of the ARR is designated for Customer Success.
-
Median CS Spend % Analysis
- <$5M ARR: 10.0%
- CS Spend is highest among smaller companies. This might be because smaller companies need to invest more in retaining and supporting customers for growth.
- 10M ARR: 9.0%
- A slight decrease but still a high percentage of the budget is spent on CS, underscoring its importance in this growth phase.
- 25M ARR: 5.0%
- Significant drop, possibly because companies in this range have more optimized processes or are beginning to achieve economies of scale.
- 50M ARR: 6.0%
- Stabilizes slightly, potentially indicating an effort to maintain a balance between scaling and customer success investments.
- 100M ARR: 10.0%
- Another peak. Companies in this range might increase spending on CS to ensure robust customer support and retention as they reach higher revenues.
- 250M ARR: 7.5%
- Slight reduction, possibly due to improved efficiency or a shift in resource allocation.
- 500M ARR: 6.0%
- Consistent with previous patterns, suggesting a balanced approach to CS spend.
- 1B ARR: 6.0%
- No significant change, possibly indicating established processes and stabilized investment in CS.
- >1B ARR: 2.5%
- Marked reduction in CS spend percentage. Larger companies may benefit from significant economies of scale and more efficient customer success operations.
- <$5M ARR: 10.0%
-
Visual Presentation
- The image simplifies complex data into an easy-to-understand bar graph.
- Visually separates different ARR ranges, making it easy to compare data points.
- The use of consistent blue coloring keeps the focus on the data without distraction.
Table Extract
| ARR Range | Median CS Spend % of ARR |
|---|---|
| <$5M | 10.0% |
| 10M | 9.0% |
| 25M | 5.0% |
| 50M | 6.0% |
| 100M | 10.0% |
| 250M | 7.5% |
| 500M | 6.0% |
| 1B | 6.0% |
| >$1B | 2.5% |
Reference: