SaaStr 2024 - Key Customer Success Topics for Investor Discussions
CS Spend % of ARR vs NRR
Overview
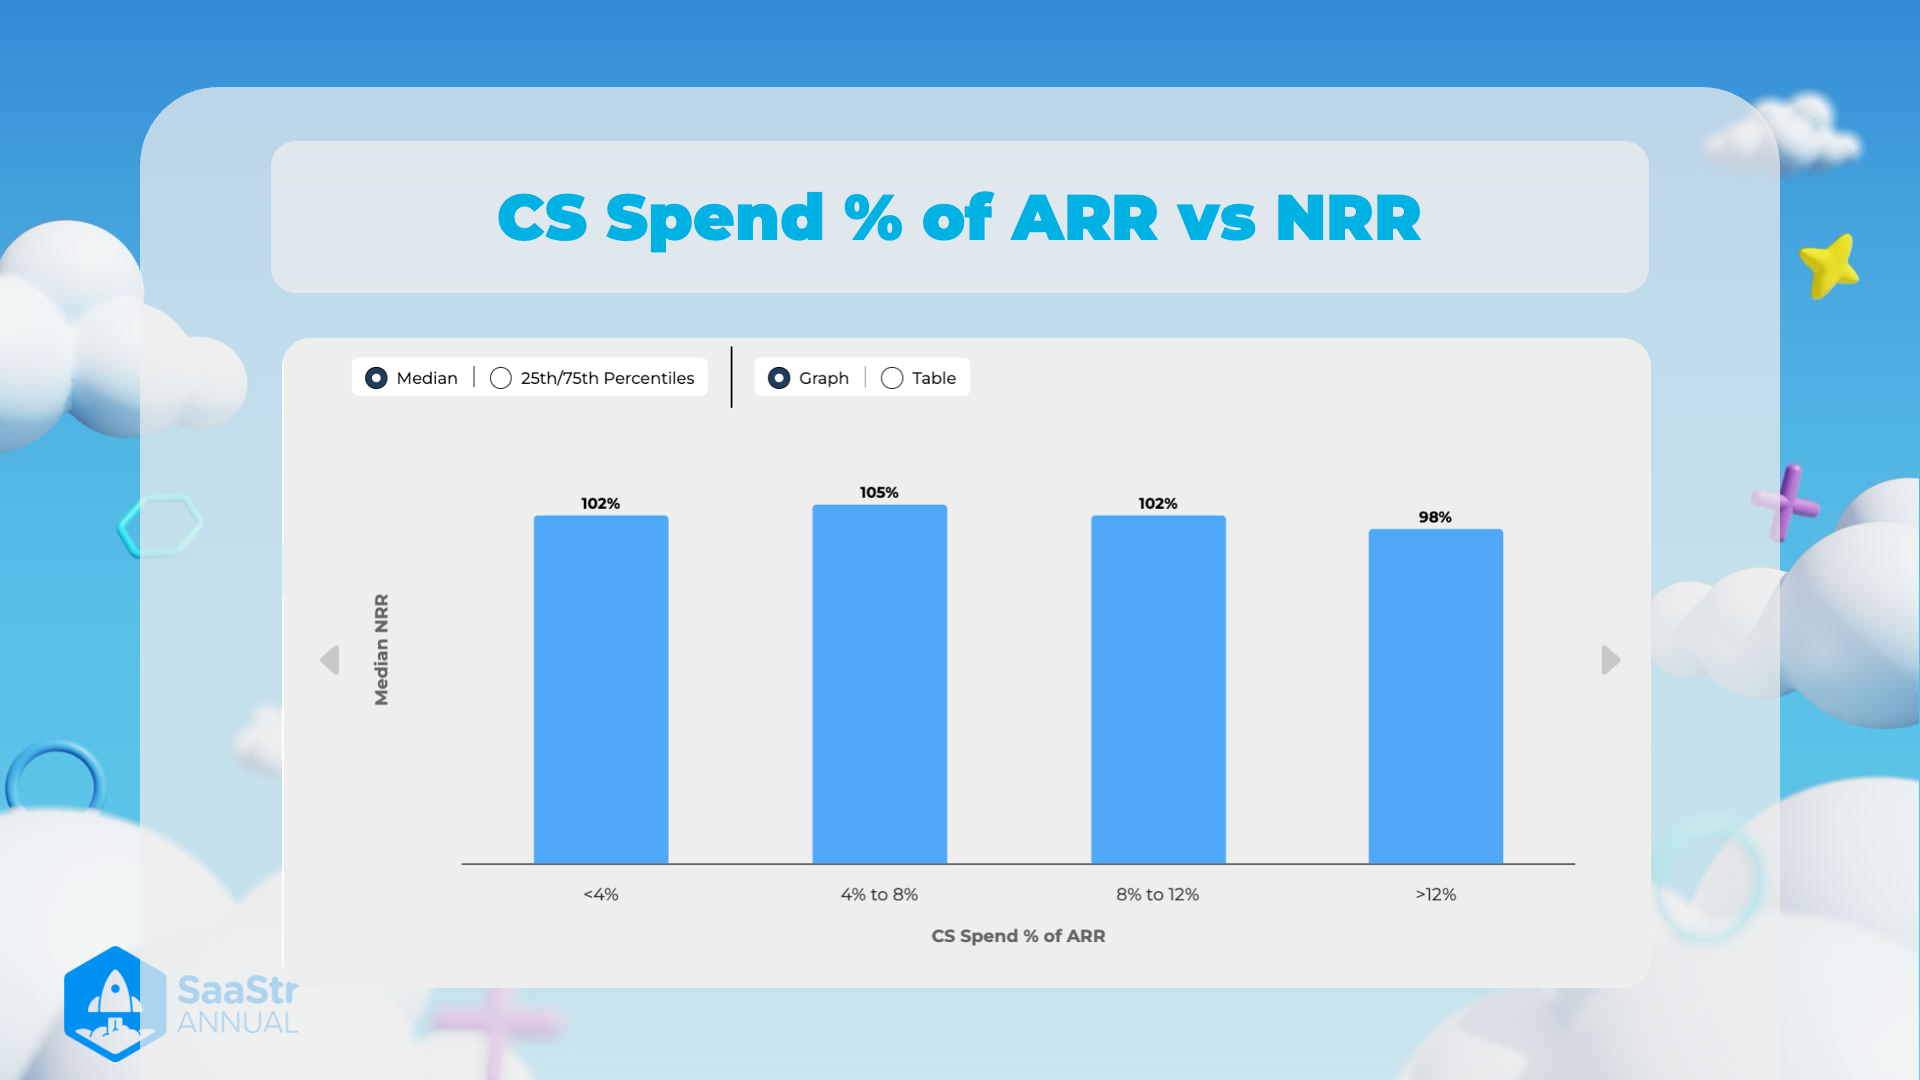
The image illustrates the relationship between Customer Success (CS) spend as a percentage of Annual Recurring Revenue (ARR) and Net Revenue Retention (NRR).
Key Points
- Median NRR Values:
- <4% CS Spend: 102%
- Indicates that with a CS spend of less than 4% of ARR, the median NRR is 102%. This suggests that even with minimal CS investment, companies are able to retain and slightly grow their revenue from existing customers.
- 4% to 8% CS Spend: 105%
- With a CS spend between 4% to 8% of ARR, the median NRR is 105%. This is the highest value among all categories, implying that this level of CS investment yields the best retention and revenue growth results.
- 8% to 12% CS Spend: 102%
- For CS spend ranging from 8% to 12% of ARR, the median NRR is again 102%. This indicates a similar outcome to spending less than 4%, and it suggests diminishing returns when increasing CS spend in this range.
- >12% CS Spend: 98%
- When CS spend exceeds 12% of ARR, the median NRR drops to 98%. This shows that a very high investment in CS does not necessarily equate to higher NRR, and may even have a negative impact.
- <4% CS Spend: 102%
Additional Observations
- Optimal CS Spend:
- The data suggests that a CS spend between 4% and 8% of ARR optimally balances investment and returns, achieving the highest median NRR of 105%.
- Diminishing Returns Beyond 8%:
- Increasing CS spend beyond 8% of ARR does not provide additional NRR benefits and may lead to lower efficiency in terms of revenue retention and growth.
Structure
Considering the image structure:
- The data is presented in column chart format, allowing a visual comparison of the median NRR across different levels of CS spend percentages.
- Graph/Table Toggle: Offers flexibility to view the data in either graphical or tabular form, though the image currently displays the graph.
Source
- Event: SaaStr Annual
- Context: This analysis is likely derived from session insights, studies, or discussions on effective CS strategies in SaaS businesses.
Reference:
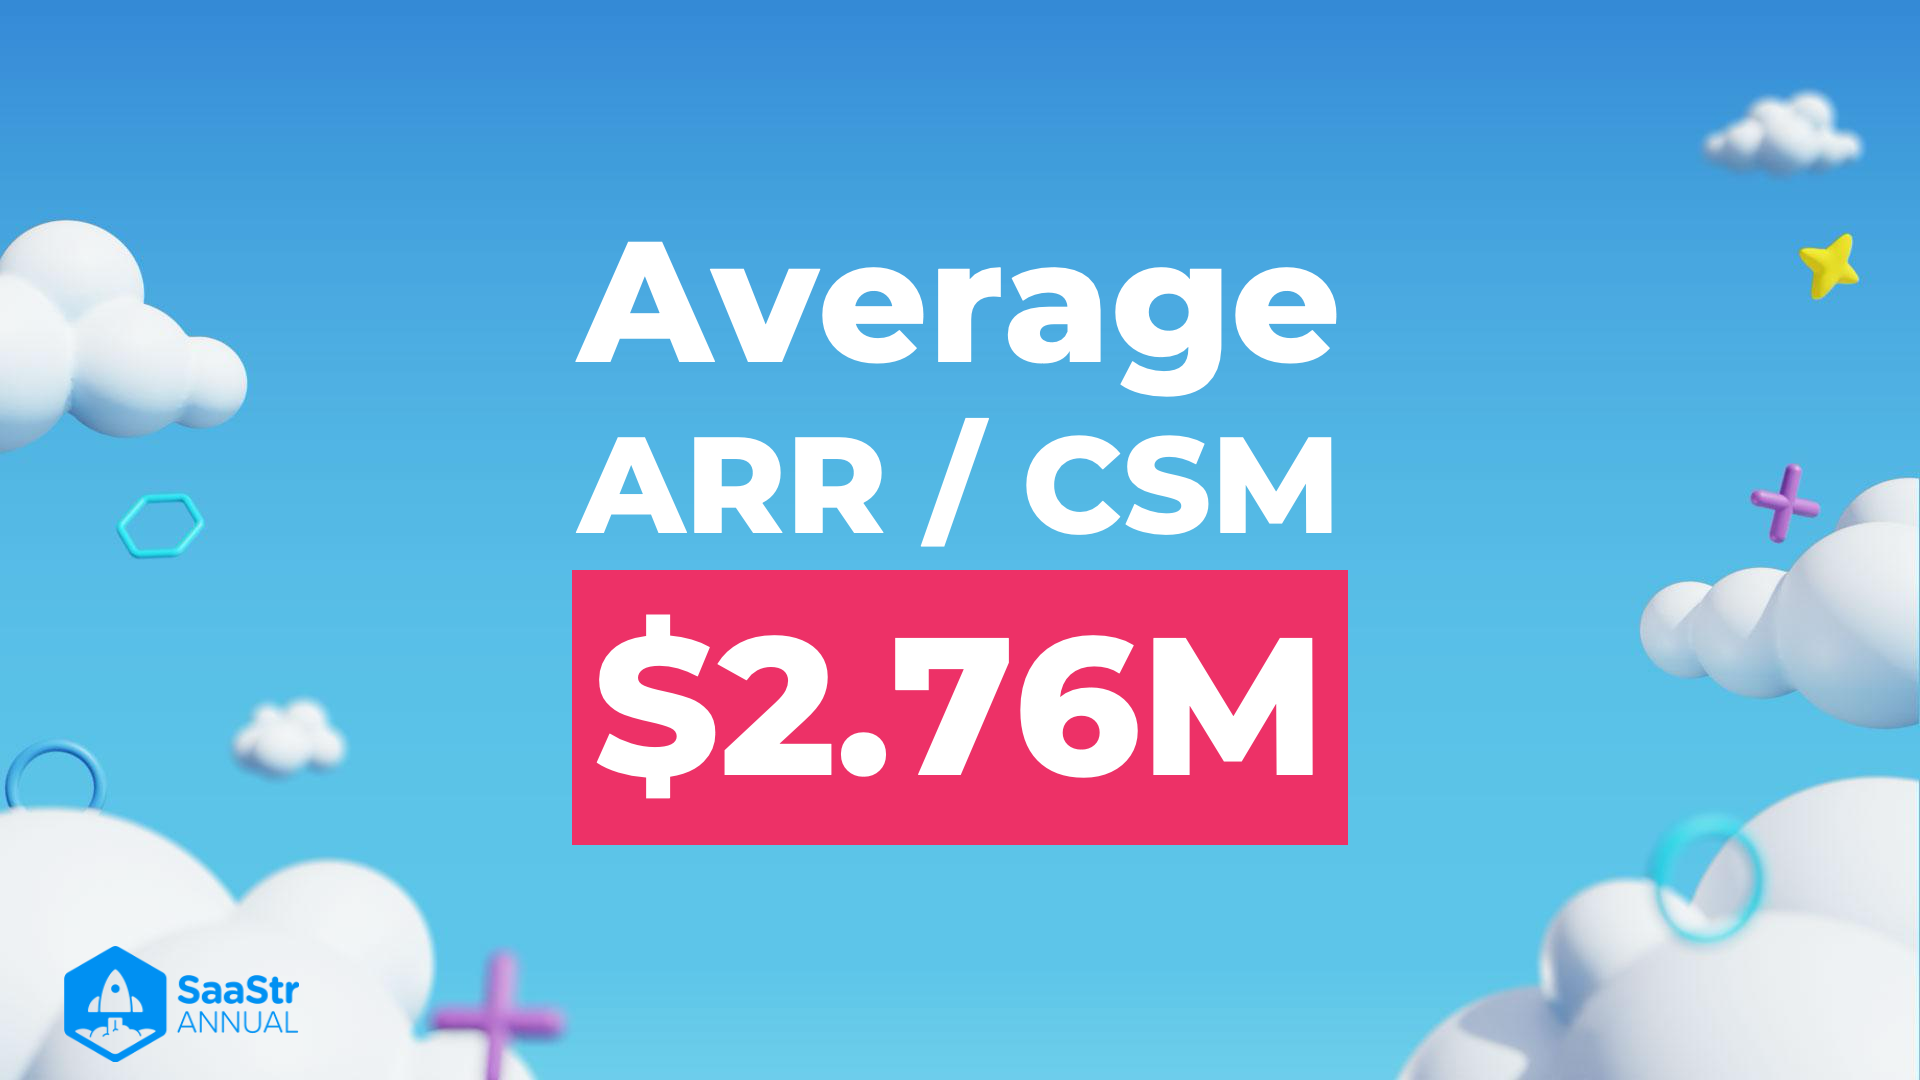
Average ARR / CSM $2.76M
-
Headline Information
- The image highlights the average Annual Recurring Revenue (ARR) per Customer Success Manager (CSM) as $2.76M.
- This metric is crucial for understanding the revenue-generating capacity and efficiency of CSMs in SaaS (Software as a Service) businesses.
-
Aesthetic
- The background features a blue sky with white clouds and colorful shapes, indicating an uplifting and positive theme.
- The design choice can imply growth, scalability, and optimism in the SaaS industry.
-
Placement & Emphasis
- The dollar value is prominently placed in the center within a pink rectangle, drawing immediate attention to the key financial metric.
- This design reflects the importance of financial metrics in assessing business performance.
-
SaaStr Annual Logo
- Situated on the bottom left, the SaaStr Annual logo signifies the source or the event associated with this data point.
- SaaStr Annual is known for its focus on the needs and metrics relevant to the SaaS community.
-
Relevance & Utility
- Companies can use this benchmark to assess if their CSM teams are performing optimally.
- An ARR/CSM value of $2.76M might serve as a goal or KPI for CSM teams aiming for industry-standard efficiency.
-
Strategic Implications
- SaaS companies might consider adjusting their CSM deployment strategies based on this metric to either increase ARR or reduce costs.
- This data point can also be used in investor presentations to showcase the effectiveness of the company's customer success strategies.
-
Additional Context
- In a SaaS business model, ARR is a critical metric because it represents a predictable and recurring revenue stream.
- Ensuring that CSMs manage adequate ARR can lead to improved customer retention and satisfaction, fueling further growth.
Average Accounts per CSM vs ACV
Overview
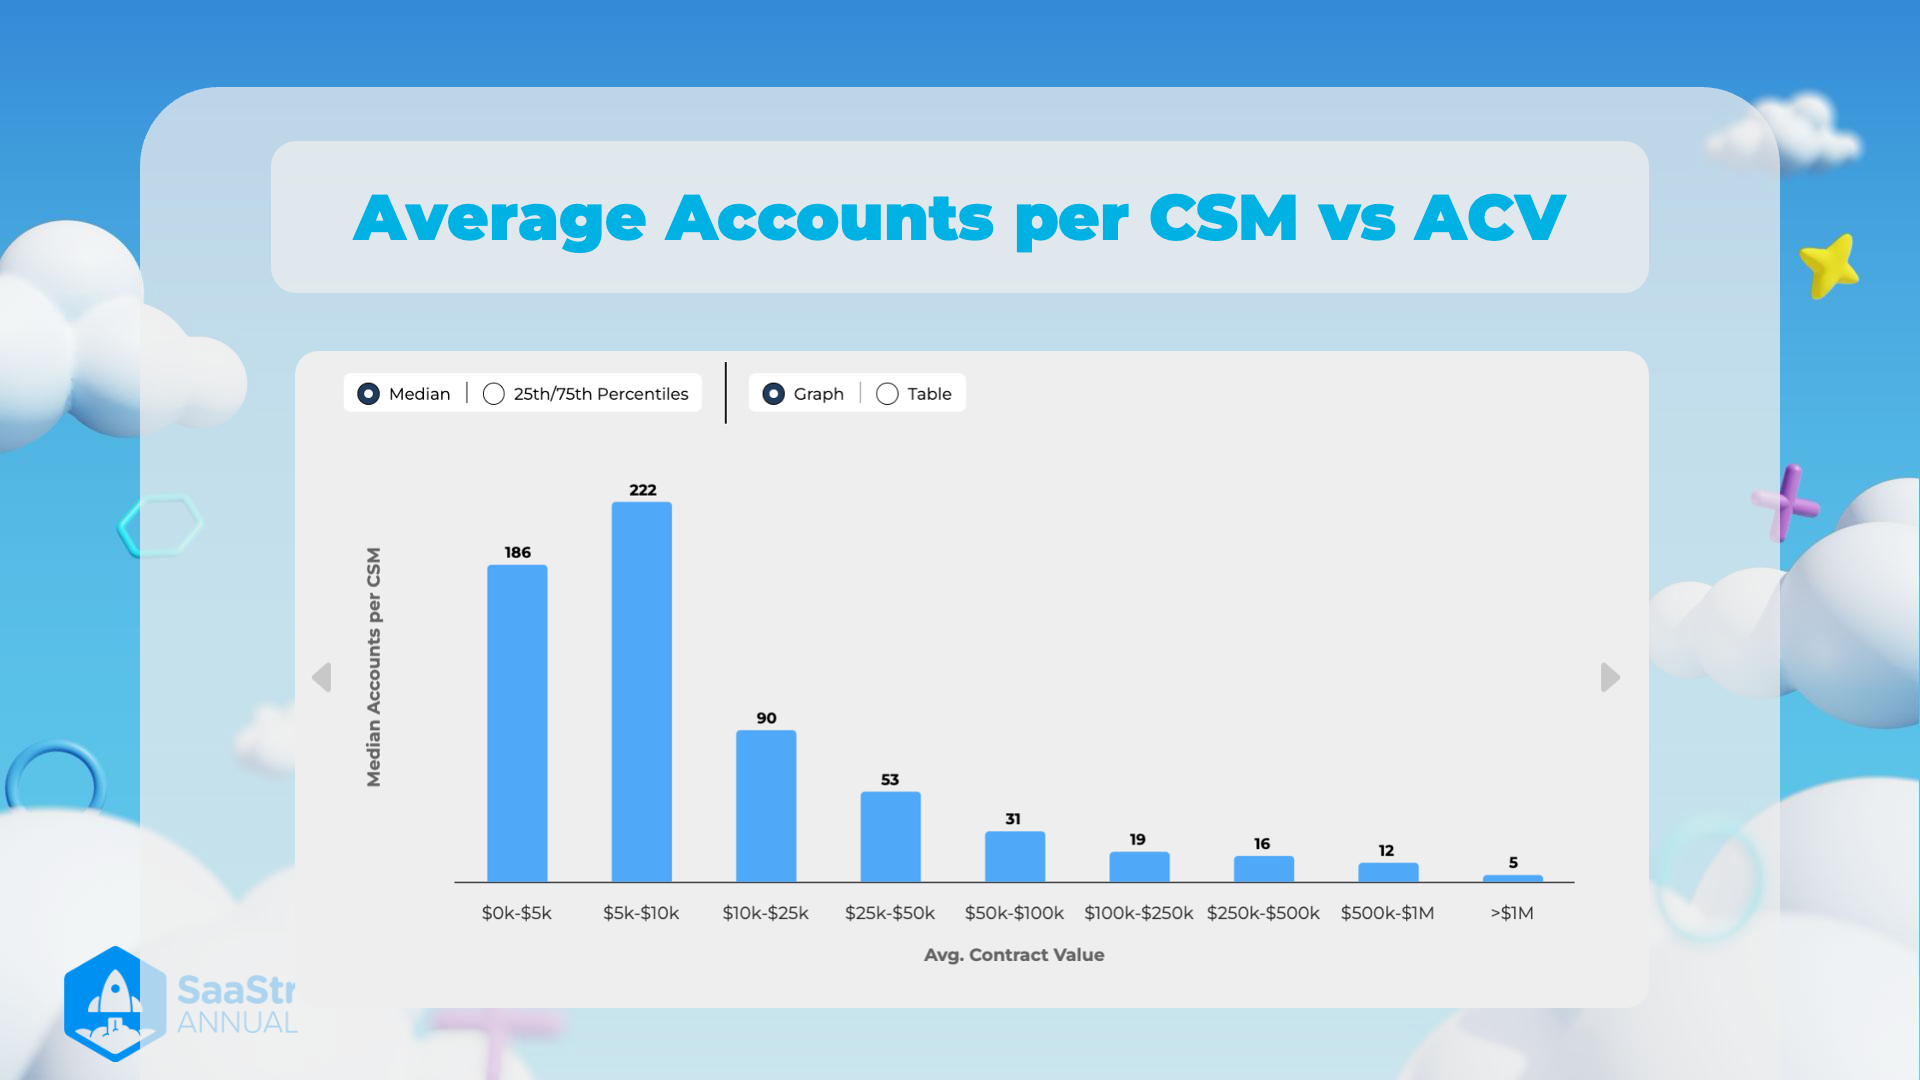
The image presents a bar graph displaying the median number of accounts managed by Customer Success Managers (CSMs) based on Average Contract Value (ACV). It showcases data segregated into different ACV ranges.
Data Presentation
The graph is organized into eight distinct ACV ranges, with the corresponding median number of accounts per CSM. An important visual aspect is the declining trend in median accounts per CSM as the ACV increases.
Table Format of the Data:
| Avg. Contract Value | Median Accounts per CSM |
|---|---|
| 5k | 186 |
| 10k | 222 |
| 25k | 90 |
| 50k | 53 |
| 100k | 31 |
| 250k | 19 |
| 500k | 16 |
| 1M | 12 |
| >$1M | 5 |
Observations and Thoughts
- High Volume, Low Value Accounts: CSMs handle a larger number of accounts in the lower ACV ranges (5k and 10k), indicating that these accounts might require less intensive management or have standardized processes that allow higher efficiency.
- Decreasing Trend: As the ACV increases, the number of accounts per CSM decreases significantly. This suggests that higher value accounts likely require more personalized and dedicated attention to ensure success, leading to fewer accounts managed by each CSM.
- Resource Allocation: These insights can be crucial for resource planning within an organization. By understanding these trends, companies can allocate CSMs based on expected workloads and ensure high-value accounts receive adequate attention.
- Potential for Automation: For lower ACV accounts, there might be an opportunity to implement automation or self-service options to manage the high volume without overburdening CSMs.
Additional Context
- Median Data Representation: The graph focuses on the median number of accounts, providing a central tendency of the data and potentially mitigating the impact of outliers.
- Visualization Choices: The choice of a bar graph effectively communicates the steep decline in accounts per CSM as the contract value increases, making it clear and easy to understand at a glance.
Reference:
CS > CSM
SaaStr Annual Logo
- Placement: Bottom-left corner of the image.
- Significance: Indicates that the event or content is related to the SaaStr Annual conference, a well-known event in the SaaS (Software as a Service) industry.
- Visual: The logo incorporates space and SaaS-related elements, such as a rocket, to emphasize growth and innovation in the SaaS field.
Cloud and Sky Theme
- Design Elements: The image features a sky-blue background with clouds, stars, and 3D geometric shapes.
- Purpose: These elements likely aim to convey an uplifting, bright, and dynamic atmosphere, aligning with themes of innovation, cloud technology, and upward growth.
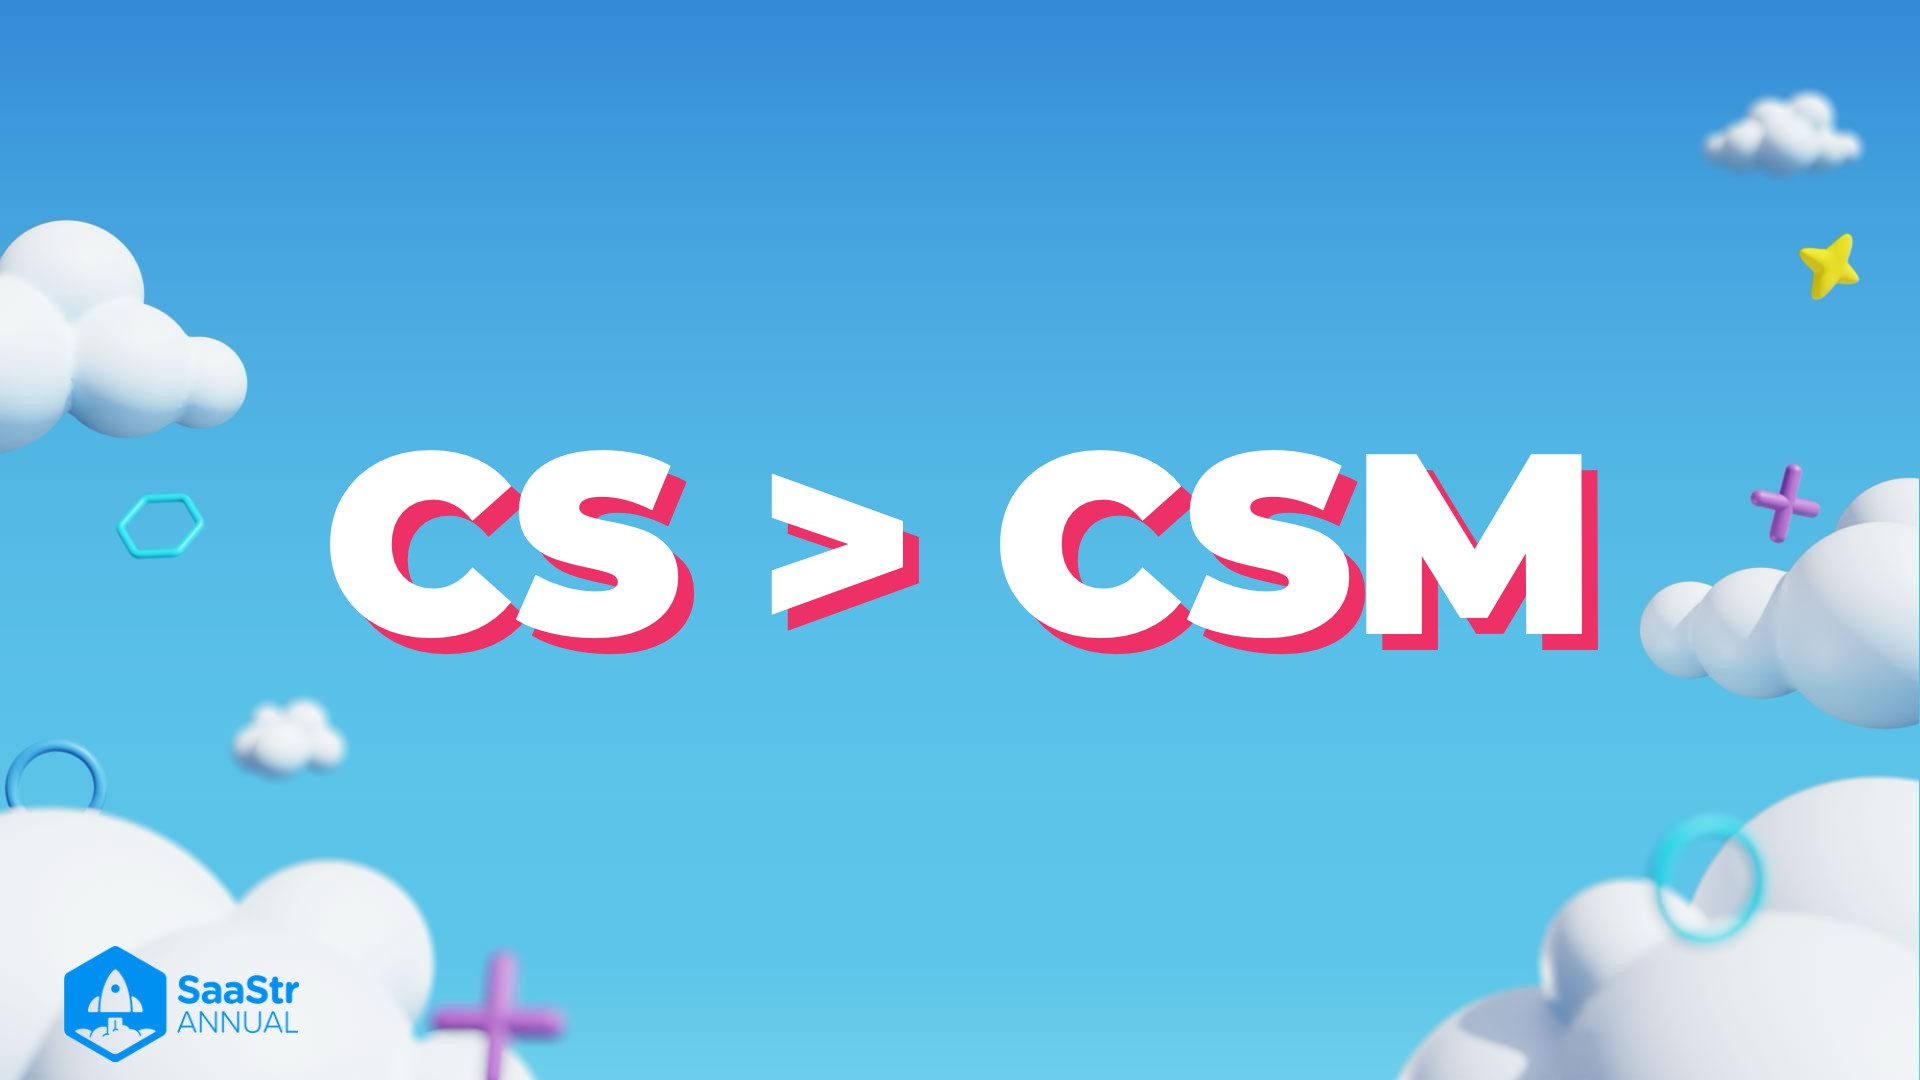
Main Text: CS > CSM
- Breakdown of Acronyms:
- CS: Often stands for Customer Success.
- CSM: Typically represents Customer Success Manager or Customer Success Management.
- Interpretation: The equation "CS > CSM" suggests that Customer Success as a whole is considered more significant or valuable than the role of Customer Success Managers alone. This could imply a focus on the overall strategy and impact of customer success as a broader concept rather than just on the individuals who manage it.
- Design: The text features bold white letters with a pink shadow, making it pop against the blue background. This highlights its importance as the central message.
Additional Context
- SaaStr Annual: This is an event dedicated to bringing together SaaS entrepreneurs, executives, and investors to discuss growth strategies, best practices, and to network.
- Relevance: Customer Success (CS) is a crucial aspect of SaaS businesses, ensuring that customers achieve their desired outcomes while using the product or service. The message emphasizes a strategic approach to customer success beyond just having managers in this role.
Reference:
SaaS Customer Journey and Experience
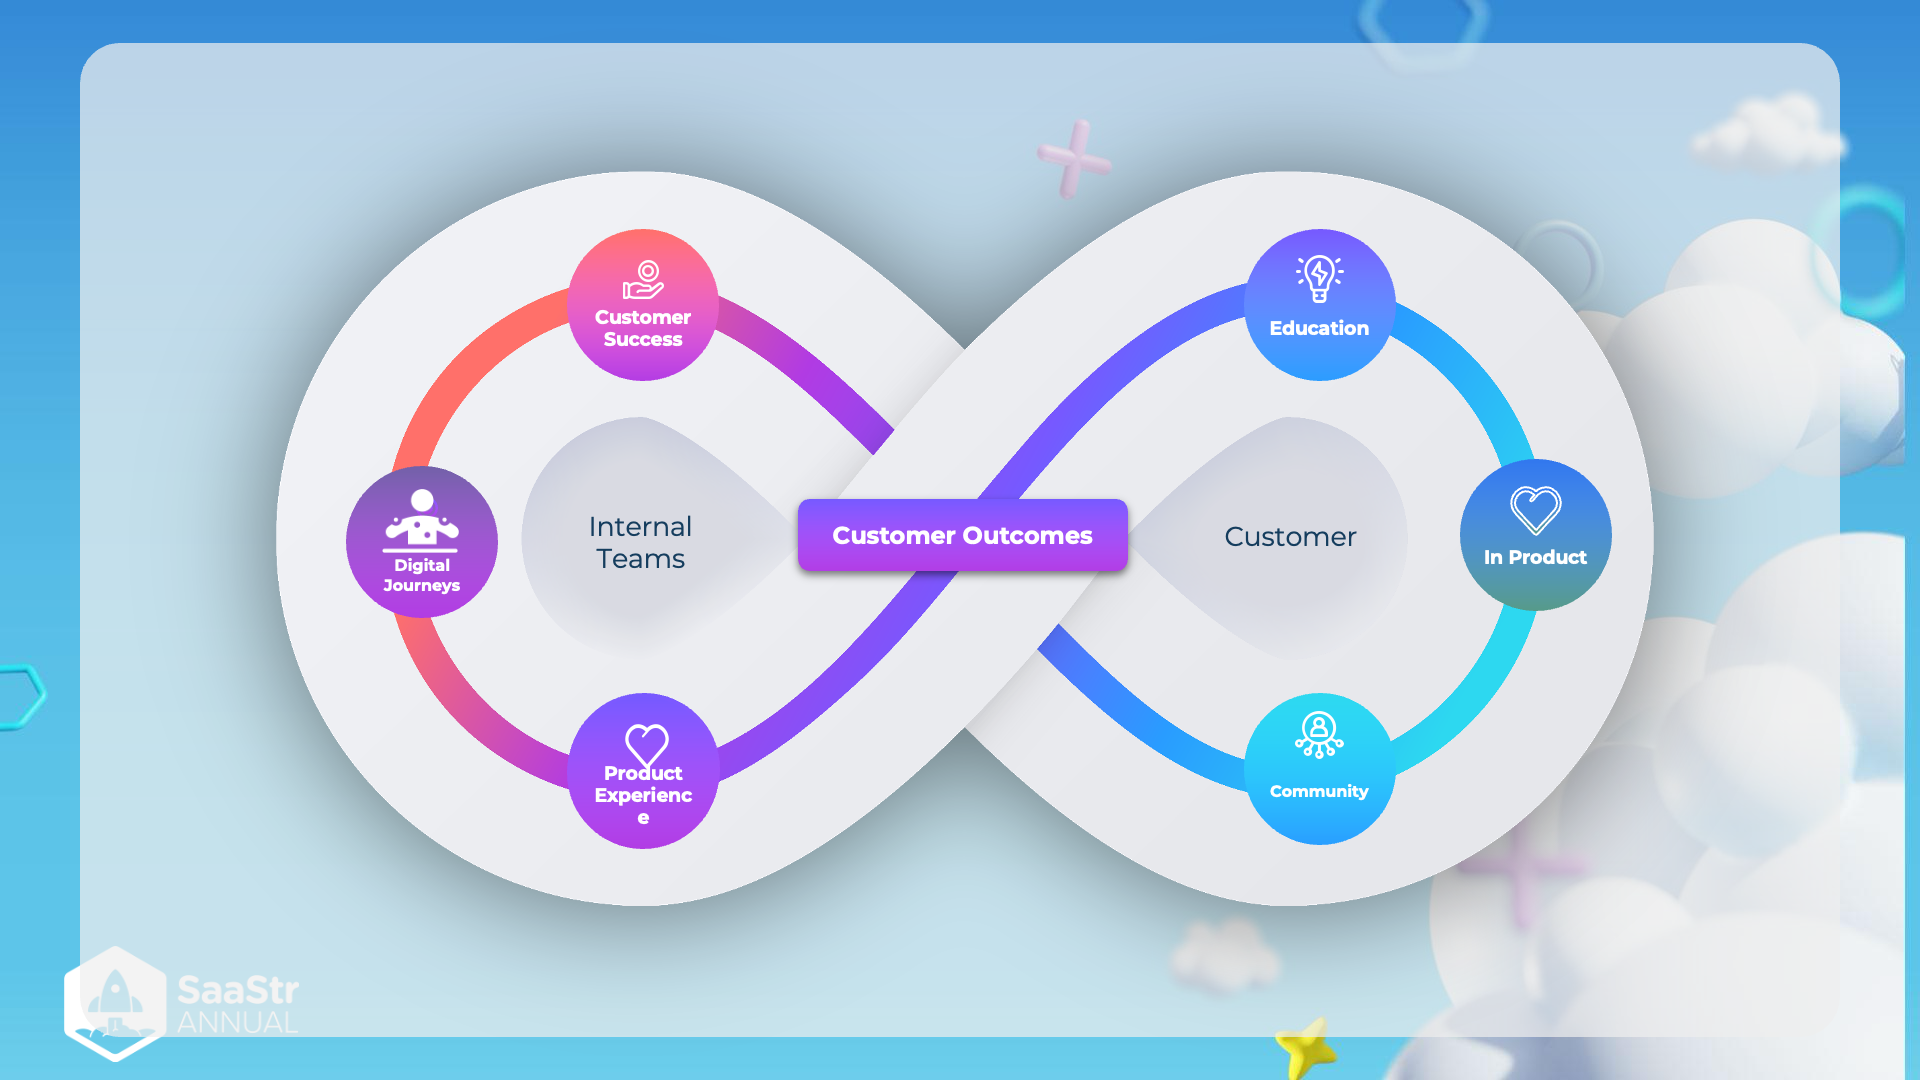
Overview
This image illustrates the interconnected and continuous journey between internal teams and customers in the SaaS (Software as a Service) industry. The focus is on achieving positive customer outcomes through coordinated efforts between different functions within a company and customer interactions.
Internal Teams
-
Customer Success
- Role: Ensures customers achieve their desired outcomes while using the product.
- Importance: Vital for customer retention and satisfaction. Customer Success teams often act as liaisons between the customer and the company.
-
Digital Journeys
- Role: Manages the digital experience of the customer journey.
- Importance: Enhances customer engagement through digital touchpoints, ensuring a seamless and effective interaction with the product.
-
Product Experience
- Role: Focuses on the usability and satisfaction derived from the product.
- Importance: A critical determinant of customer loyalty and product adoption. A positive product experience is often a result of responsive and intuitive product design.
Customer
-
Education
- Role: Provides knowledge and resources to help customers use the product effectively.
- Importance: Empowers customers, reduces support costs, and boosts customer satisfaction by enabling users to fully utilize the product features.
-
In Product
- Role: In-app guidance, support, and feedback mechanisms.
- Importance: Directly impacts user experience by offering help and making the product more user-friendly.
-
Community
- Role: Encourages interaction among users to share experiences and solutions.
- Importance: Builds a sense of belonging and loyalty among customers. Users can learn from each other, thereby enhancing their overall experience.
Central Concept: Customer Outcomes
- The ultimate goal of both internal teams and customer-facing efforts is to drive positive outcomes for customers, which, in turn, benefits the company through sustained engagement and loyalty.
Summary
The image uses an infinity loop to represent the ongoing and symbiotic relationship between a company's internal teams and its customers. Each team and each customer-facing component continuously feed into achieving desirable customer outcomes, emphasizing an ongoing cycle of improvement, engagement, and satisfaction.
Human-First AI Playbook
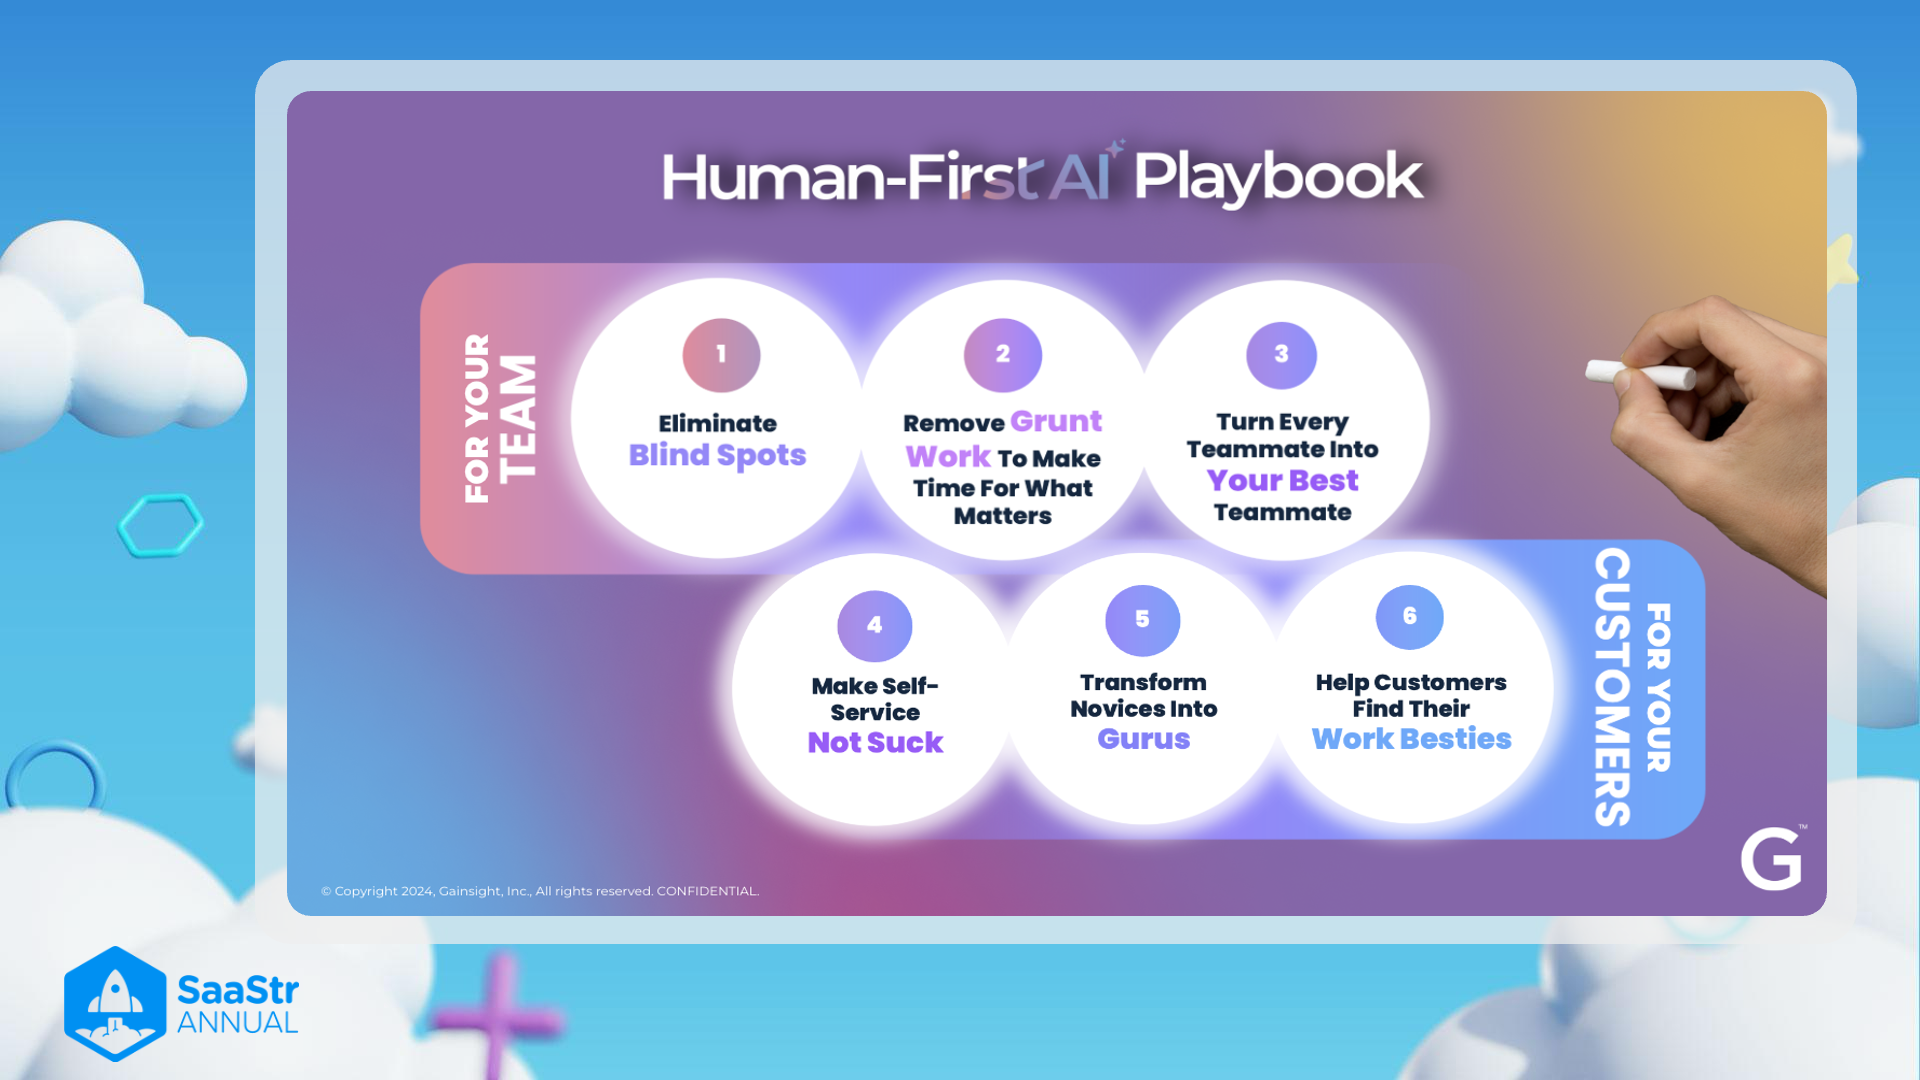
For Your Team
-
Eliminate Blind Spots
- Identifying and addressing areas where information is missing or underutilized.
- This can help in making better decisions and improving overall productivity.
-
Remove Grunt Work To Make Time For What Matters
- Automating or outsourcing repetitive and mundane tasks.
- Allows team members to focus on higher-value activities, leading to increased job satisfaction and efficiency.
-
Turn Every Teammate into Your Best Teammate
- Leveraging AI to enhance the capabilities of each team member.
- Ensuring that all team members can contribute at their highest potential, fostering a collaborative and high-performance work environment.
For Your Customers
-
Make Self-Service Not Suck
- Improving self-service options to be user-friendly and effective.
- Enables customers to resolve their issues efficiently, improving their experience and satisfaction.
-
Transform Novices into Gurus
- Providing tools and resources that help customers become experts in using the product.
- Enhances customer empowerment and retention.
-
Help Customers Find Their Work Besties
- Facilitating connections between customers to build a supportive community.
- Encourages knowledge sharing and collaboration among users, enhancing their experience with the product.
This playbook focuses on leveraging AI to enhance both team and customer experiences by addressing key areas that improve productivity, satisfaction, and community building.
Reference:
Neuron X Customer Dashboard
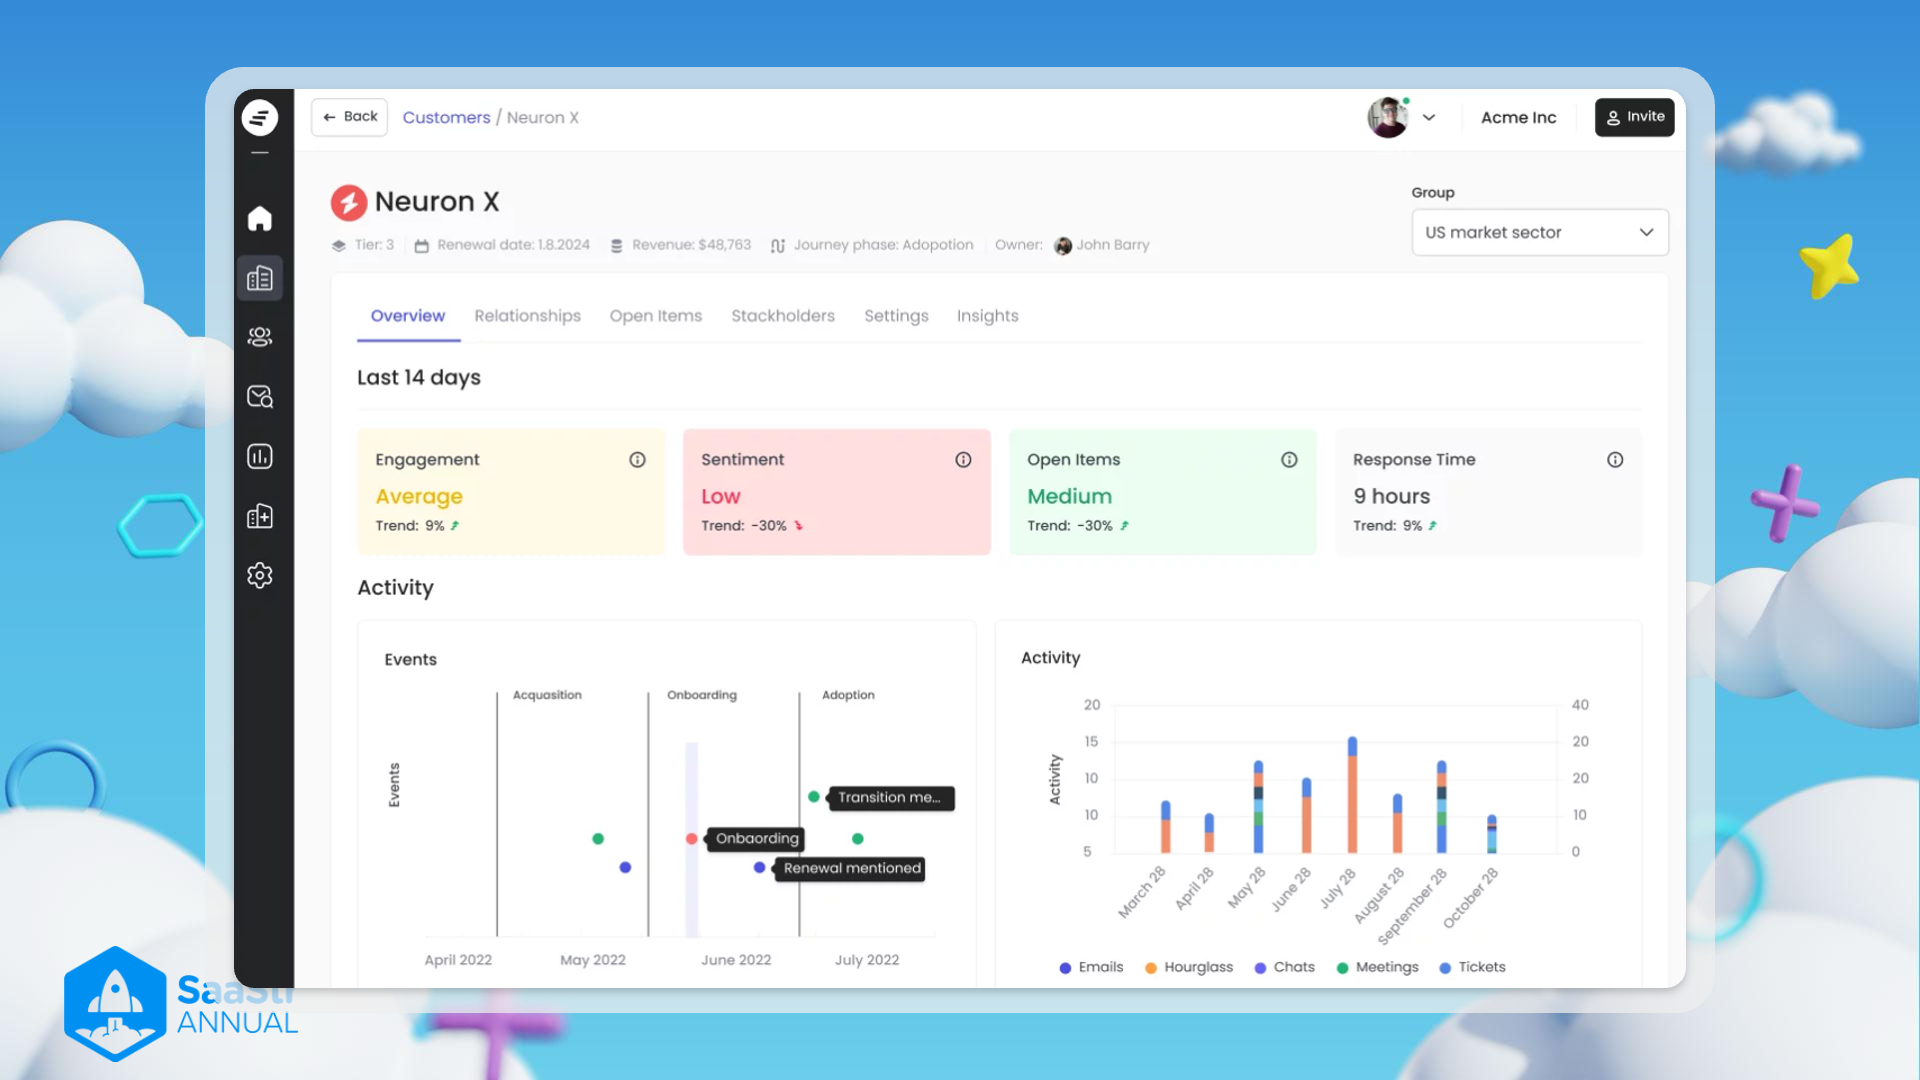
Overview Section
- Tier: 3
- Indicates the level or classification of the customer. In this case, Neuron X is classified as a Tier 3 customer.
- Renewal Date: 1.8.2024
- The date when the contract or subscription with the customer is set to renew. Useful for preparing renewal strategies.
- Revenue: $48,763
- Total revenue generated from Neuron X. This gives an idea of the customer's monetary contribution.
- Journey Phase: Adoption
- Current phase in the customer journey. Indicates that Neuron X is in the adoption phase.
- Owner: John Barry
- Employee responsible for managing the relationship with Neuron X.
Last 14 Days Section
- Engagement: Average (Trend: 9% ↗)
- Engagement level with the customer. It's showing an average rating with an increasing trend of 9%.
- Sentiment: Low (Trend: -30% ↓)
- Customer sentiment towards the company is low with a decreasing trend of 30%.
- Open Items: Medium (Trend: -30% ↘)
- Number of unresolved or pending tasks. It is currently medium but the trend is decreasing by 30%.
- Response Time: 9 hours (Trend: 9% ↗)
- Average response time to customer queries or issues. Currently 9 hours with an improving trend of 9%.
Activity Section
- Activity Categories:
- Events:
- Major milestones like Acquisition, Onboarding, and Adoption.
- Events Timeline:
- Acquisition: April 2022
- Onboarding: June 2022
- Adoption: Starting from June 2022 to ongoing.
- Events Timeline Visualization:
- Shows specific activities such as Transition meetings, Onboarding, and mentions of renewals.
- Activity (Bar Chart) :
- Tracks different types of activities over time (Emails, Hourglass, Chats, Meetings, Tickets).
- Activity Date Range:
- March 28
- April 28
- May 28
- June 28
- July 28
- August 28
- September 28
- October 28
- Events:
Navigation Menu
- Icons (from top to bottom):
- Home
- Customers
- Relationships
- Reports
- Settings
User Information
- Group: US market sector
- Group classification which the user is part of. In this case, it's the US market sector.
- User Profile: Acme Inc.
- Indicates the organization the user is associated with.
- Invite Button: For inviting other users to the platform.
Visual Design
- UI Elements:
- The interface uses a clean and minimal design with pastel colors and straightforward navigation.
- Background:
- Features a sky with clouds and animated elements, adding a playful element to the design.
Additional Metrics
- Trend Indicators:
- Engagement (9% ↗)
- Sentiment (-30% ↓)
- Open Items (-30% ↘)
- Response Time (9% ↗)
These notes capture the essential information and offer insights into the customer relationship management platform's usability and purpose.
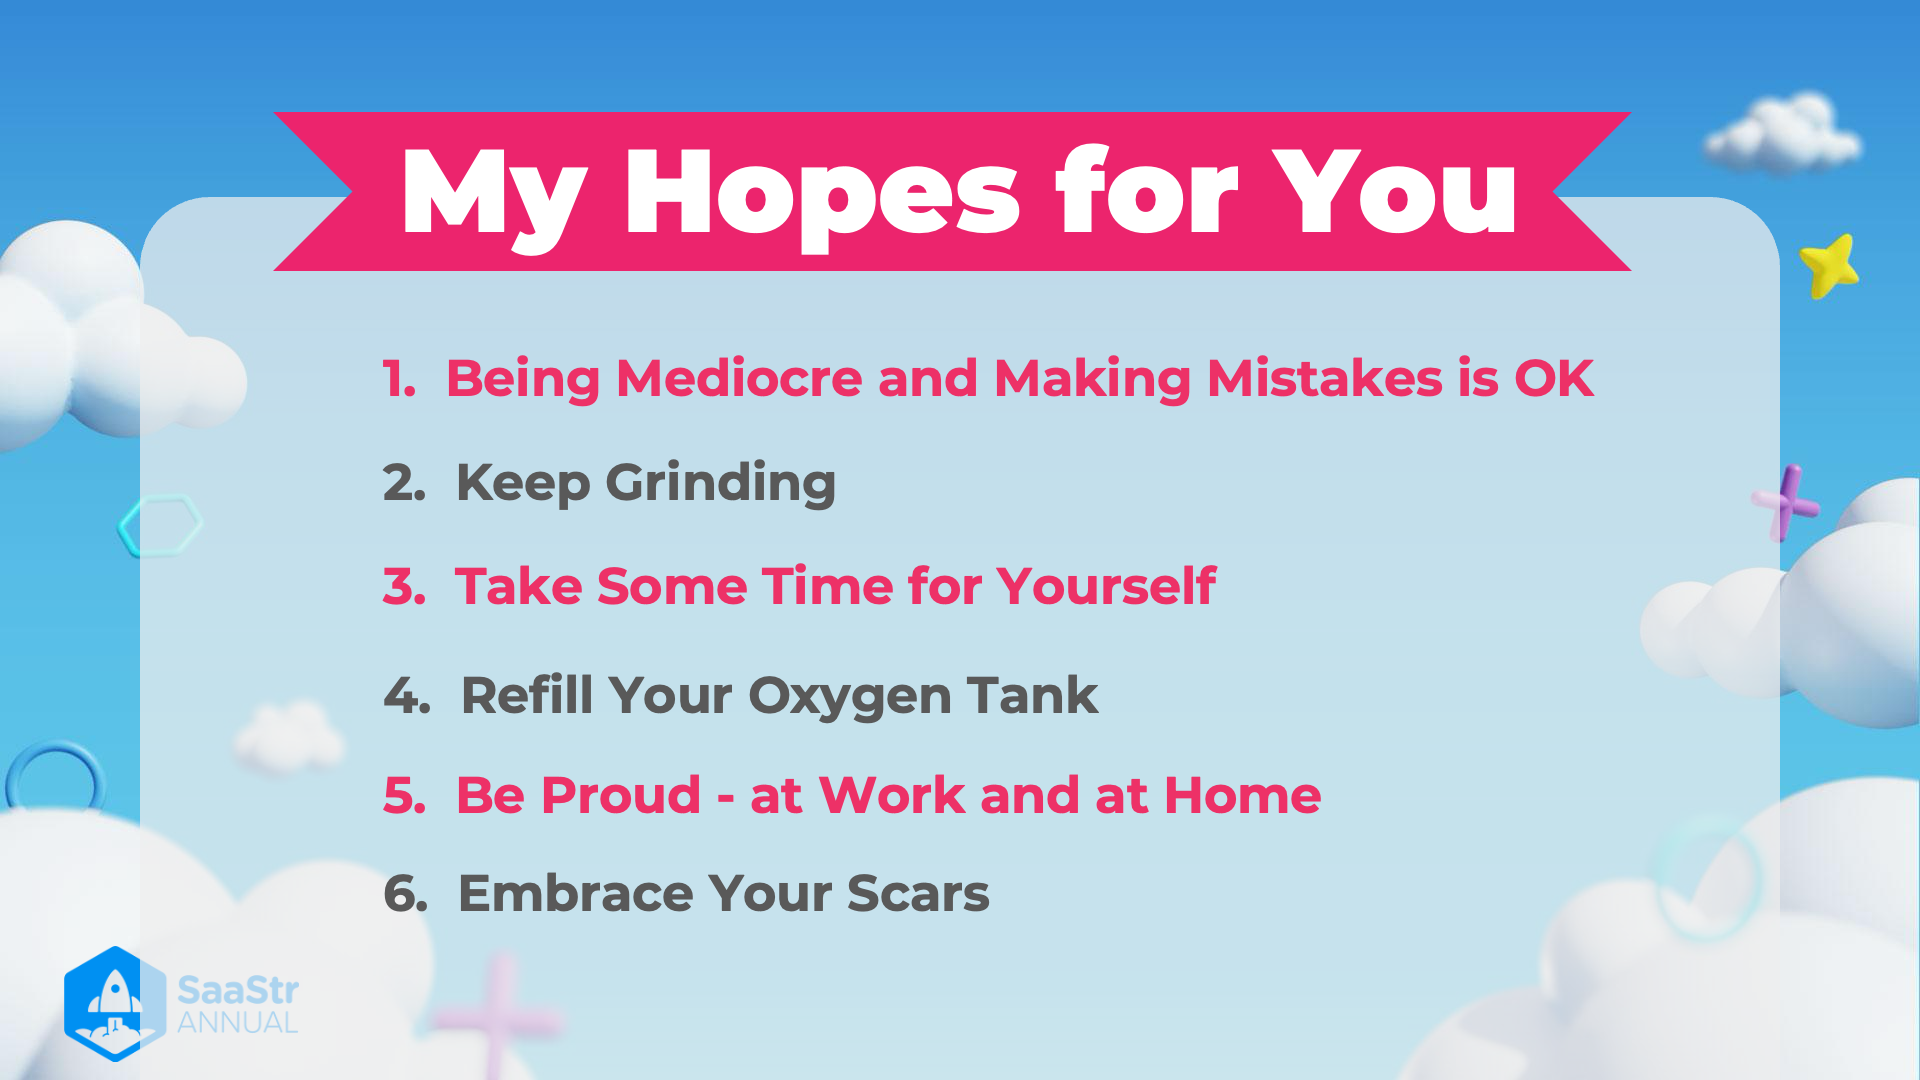
My Hopes for You
-
Being Mediocre and Making Mistakes is OK
- It's important to embrace imperfection and understand that making mistakes is a natural part of growth. Don’t aim for constant perfection; instead, focus on learning from every experience.
-
Keep Grinding
- Persistence and hard work are key to achieving success. Even on tough days, maintain your efforts towards your goals.
-
Take Some Time for Yourself
- Self-care is crucial for maintaining overall well-being. Schedule some personal time to relax and recharge.
-
Refill Your Oxygen Tank
- Analogous to the oxygen mask on an airplane, take care of your needs first so you can be better equipped to help others.
-
Be Proud - at Work and at Home
- Celebrate your achievements in all aspects of your life. Acknowledge your efforts and be proud of what you accomplish both professionally and personally.
-
Embrace Your Scars
- View your scars as symbols of your strength and resilience. They are a testament to the challenges you’ve faced and overcome.
This image from SaaStr Annual conveys a motivational message about self-acceptance, perseverance, self-care, and pride in personal and professional life.
Reference: